. 2016 Mar 16:6:23204.
doi: 10.1038/srep23204.

C9orf72 ablation causes immune dysregulation characterized by leukocyte expansion, autoantibody production, and glomerulonephropathy in mice

Affiliations

C9orf72 ablation causes immune dysregulation characterized by leukocyte expansion, autoantibody production, and glomerulonephropathy in mice

Amanda Atanasio et al. Sci Rep. .

Abstract

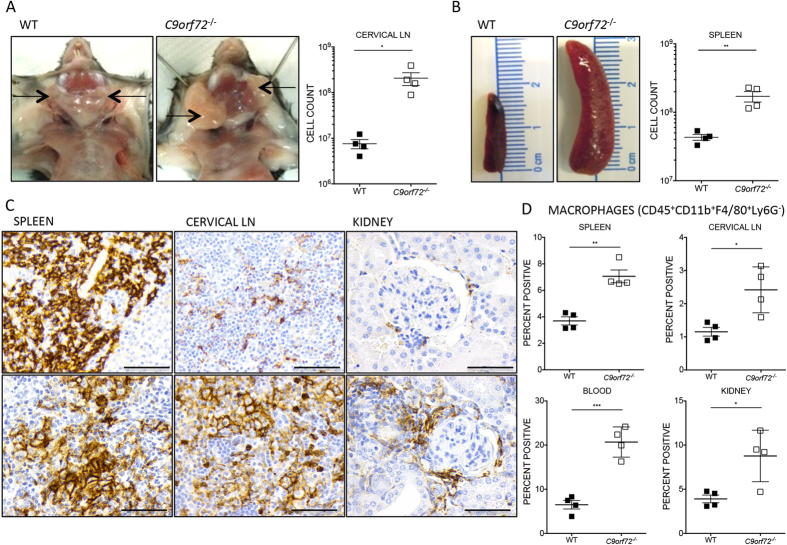
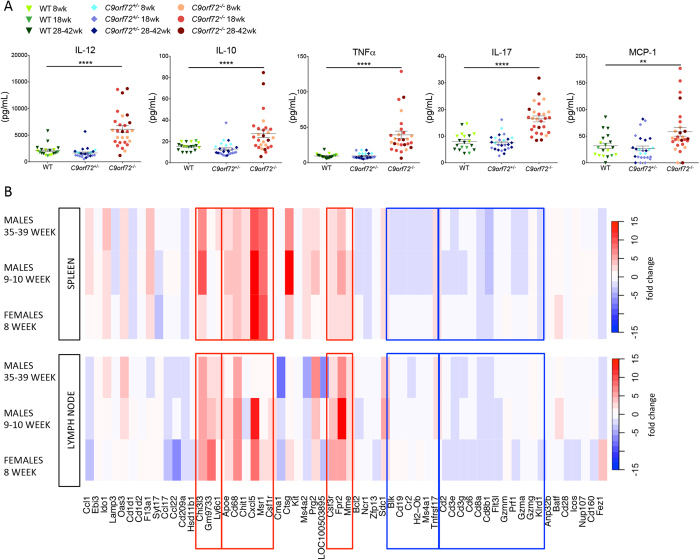
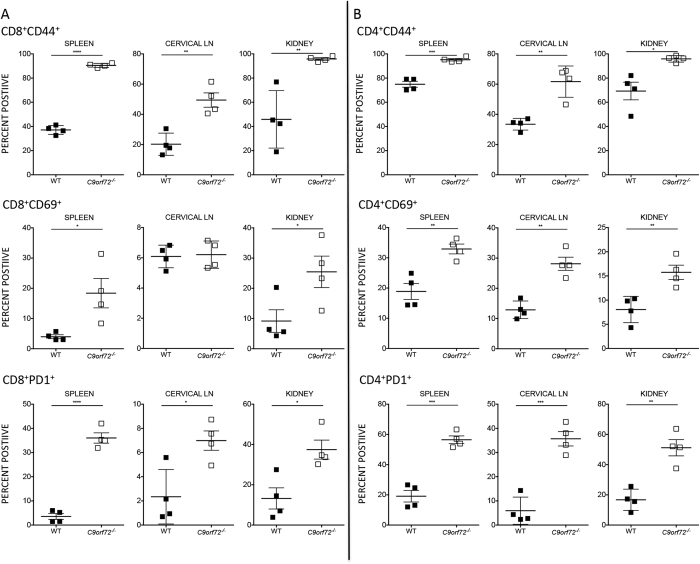
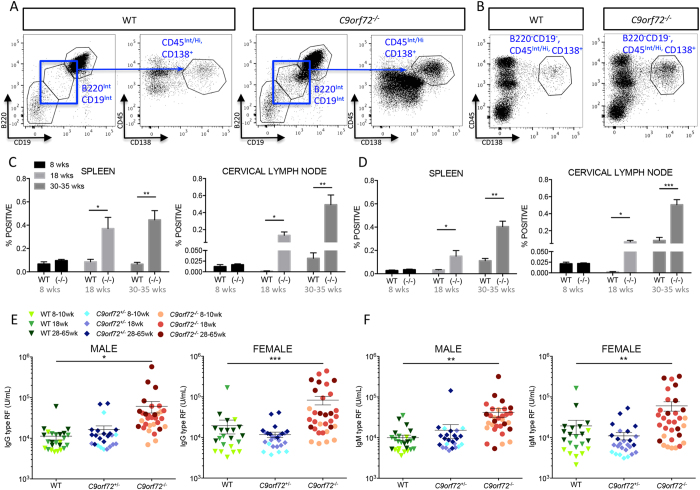
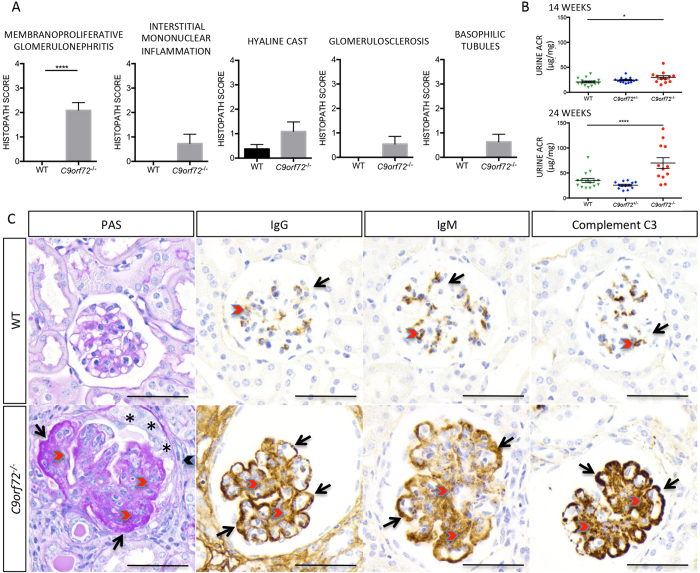
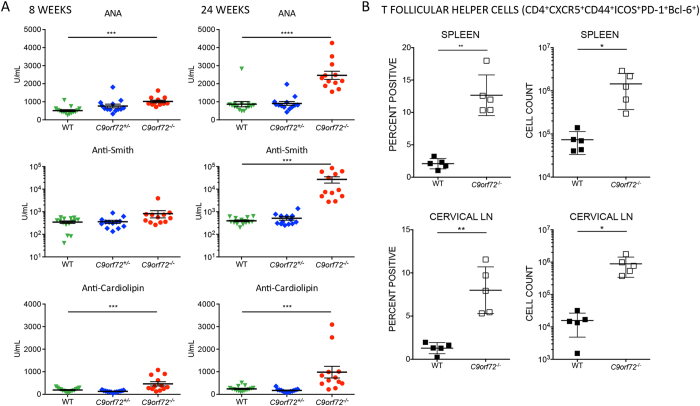
The expansion of a hexanucleotide (GGGGCC) repeat in C9ORF72 is the most common cause of amyotrophic lateral sclerosis (ALS) and frontotemporal dementia (FTD). Both the function of C9ORF72 and the mechanism by which the repeat expansion drives neuropathology are unknown. To examine whether C9ORF72 haploinsufficiency induces neurological disease, we created a C9orf72-deficient mouse line. Null mice developed a robust immune phenotype characterized by myeloid expansion, T cell activation, and increased plasma cells. Mice also presented with elevated autoantibodies and evidence of immune-mediated glomerulonephropathy. Collectively, our data suggest that C9orf72 regulates immune homeostasis and an autoimmune response reminiscent of systemic lupus erythematosus (SLE) occurs in its absence. We further imply that haploinsufficiency is unlikely to be the causative factor in C9ALS/FTD pathology.


Figures

Figure 1
Figure 1. C9orf72−/− mice develop lymphadenopathy and splenomegaly, and display infiltration of F4/80+ cells by IHC and FACS Analysis.
(A,B) Representative pictures of gross cervical LN enlargement and splenomegaly observed in C9orf72−/−in comparison to age-matched WT control. Significantly increased cell counts obtained via FACS analysis correspond to lymphadenopathy and splenomegaly observed grossly. (C) The expanded cell populations infiltrating the red pulp of the spleen and surrounding lymphoid follicles of the cervical LN stained positive by IHC for mouse macrophage marker F4/80. Periglomerular infiltrates observed in C9orf72−/− kidneys are also largely positive for F4/80 macrophage lineage marker. Sections shown are females, 37 week old C9orf72−/− and 40 week old WT (D) FACS analysis confirmed H&E and IHC findings by showing increased percentages of CD11b+F4/80+Ly6G macrophages in kidney, spleen, cervical LN, and blood (30–35 week old female, n = 4 per genotype). (AD) Data are shown as mean ± s.e.m (*P ≤ 0.05, **P ≤ 0.01 and ***P ≤ 0.001 by unpaired Students t-test). (C) Scale bar represents 50 μm, original magnification, ×600.
Figure 2
Figure 2. Serum cytokine data and molecular profiling signatures indicate myeloid cell infiltration and involvement of macrophage activating pathways in C9orf72−/− mice.
(A) C9orf72−/− show increased levels of circulating cytokines and chemokines involved with macrophage recruitment and activation. C9orf72+/− mice demonstrate values comparable to WT, consistent with absence of any observed phenotype. Graphs represent mean ± s.e.m. (**P ≤ 0.01 and ****P ≤ 0.0001 by one-way ANOVA) from 8–38 week female mice, n ≥ 19 per genotype. (B) Molecular profiling signatures from C9orf72−/− spleen and cervical LN suggest infiltration of macrophage, monocyte, and granulocyte cell populations by increased expression of associated markers. Depletion of T and B cells is also indicated, which may reflect the increase in proportion of myeloid cells. Data shown is from 8 week old females, 9–10 week old males, and 35–39 week old males, n ≥ 3 per genotype.
Figure 3
Figure 3. C9orf72−/− mice show increased expression of T cell activation markers by FACS analysis.
(A) CD8+ T cell summary data reflect increases in the percentage of CD8 T cells expressing the activation markers CD44 and CD69 and the co-inhibitory receptor PD-1 in C9orf72−/− compared with WT. (B) Similarly, CD4+ T cell summary data represent increased percentages of C9orf72−/− CD4 T cells expressing CD44, CD69, and PD1 in spleen, cervical LN, and kidney with varying significance. Graphs represent mean ± s.e.m. (*P ≤ 0.05, **P ≤ 0.01, ***P ≤ 0.001, ****P ≤ 0.0001 by unpaired Students t-test) 30–35 week females, n = 4 per genotype.
Figure 4
Figure 4. Increased percentages of plasma cells and autoantibody production contribute to autoimmune dysfunction in C9orf72−/− mice.
(A) FACS analysis reveals a population of cells transitioning from mature B cells to plasma cells indicated by a decrease in expression of mature B cell markers, CD19 and B220 (blue box), and concomitant strong expression of the mature plasma cell marker CD138. Gating strategy from WT and C9orf72−/− 18 week male spleen is represented to show a transitioning plasma cell population that is prominent in C9orf72−/− compared with WT. (B) Gating strategy for a mature plasma cell population (B220CD19CD45Int/HiCD138+) in 18 week male spleen demonstrates increased mature plasma cells in C9orf72−/−compared with WT. (C) Graphical representation of increased transitioning and (D) mature plasma cell populations by FACS analysis shows significantly increased percentages in C9orf72−/−spleen and LN in comparison to WT at 18 weeks of age and older. (E,F) Serum ELISA assays indicate significant increases in IgG and IgM type RF autoantibodies, consistent with the observed systemic autoimmune response in null mice. C9orf72+/− mice display values comparable to WT, consistent with absence of any observed phenotype. (C,D) Graphs represent mean ± s.e.m. (*P ≤ 0.05, **P ≤ 0.01 and ***P ≤ 0.001 by unpaired Students t-test), n = 4 females per genotype (E,F) Graphs represent mean ± s.e.m. (*P ≤ 0.05, **P ≤ 0.01 and ***P ≤ 0.001 by one-way ANOVA), n ≥ 22 per genotype, 9–65 week old males and 8–42 week old females.
Figure 5
Figure 5
C9orf72−/− mice show evidence of progressive glomerulonephropathy (A) Weighted graphs of histopathological scoring demonstrate the most significant renal changes observed in C9orf72−/− mice are associated with membranoproliferative glomerulonephritis. (B) Urine ACR measurements assayed at 14 and 24 week timepoints from the same cohort of mice indicate onset of albuminuria in C9orf72−/− animals with age. Heterozygous mice display values comparable to WT consistent with the absence of an observed phenotype. (C) PAS Staining and IHC immunoreactivity of mouse glomeruli for IgG, IgM, and C3 demonstrate immune-mediated kidney damage. Mesangial matrix (red chevron) is PAS+ and markedly expanded in C9orf72−/− mouse compared with the delicate matrix seen in the WT. Basement membrane of the vasculature is markedly expanded by PAS+ matrix (black arrows), obliterating the capillary loop. The parietal epithelium is proliferative (*), and Bowman’s capsule is surrounded by connective tissue and mononuclear cells (black chevron). IHC for IgG, IgM, and C3 in WT (top panel) shows delicate capillary loops (black arrows) supported by scant mesangial matrix; faint chromogenic staining of the capillary endothelia is representative of physiologic IgG, IgM, and C3. IHC stippling is also observed in the mesangium (red chevrons). In contrast, glomeruli from C9orf72−/− mice have increased mesangial matrix (red chevrons) and granular deposits of IgG, IgM, and C3. Capillary loop basement membranes are thickened and delineated by subendothelial/subepithelial granular to confluent deposits (black arrows). Chromogenic staining for IgG is also apparent in surrounding renal tissue. Note the increased size of the C9orf72−/− glomerulus compared with that of the WT, and the increase in the urinary space of the glomerulus. (A,C) Data represented is from 35–63 week old females, n ≥ 8 per genotype analyzed. Scale bar represents 50 μm, original magnification, ×600. (A) Graphs represent mean ± s.e.m. (***P ≤ 0.0001 by non-parametric Mann-Whitney) (B) Graphs represent mean ± s.e.m. (*P ≤ 0.05, ***P ≤ 0.0001 by one way ANOVA).
Figure 6
Figure 6. C9orf72−/− mice show increased serum autoantibodies and increased T follicular helper cells reminiscent of human SLE.
(A) Serum ELISAs from the same cohort of mice assayed at 8 and 24 weeks of age demonstrate elevated levels of circulation ANA and SLE-specific autoantibodies, anti-Sm, and anti-cardiolipin as early as 8 weeks in C9orf72−/−mice. At 24 week timepoint, all three autoantibodies are significantly increased in null mice with fold increases observed in comparison to WT. Heterozygous mice display values comparable to WT consistent with the absence of an observed phenotype. (B) Tfh cells (CD4+CXCR5+CD44+ICOS+PD-1+Bcl-6+) are significantly increased by percent and total cell count in C9orf72−/− spleen and cervical LN (A) Graphs represent mean ± s.e.m. (***P ≤ 0.001 and ****P ≤ 0.0001 by one-way ANOVA), 8 and 24 week females, n ≥ 12 per genotype. (B) Graphs represent mean ± s.e.m. (*P ≤ 0.05, **P ≤ 0.01 by unpaired Students t-test), 26 week females, n = 5 per genotype.

Comment in

References

    1. DeJesus-Hernandez M. et al. Expanded GGGGCC hexanucleotide repeat in noncoding region of C9ORF72 causes chromosome 9p-linked FTD and ALS. Neuron 72, 245–256 (2011). - PMC - PubMed
    1. Renton A. E. et al. A hexanucleotide repeat expansion in C9ORF72 is the cause of chromosome 9p21-linked ALS-FTD. Neuron 72, 257–268 (2011). - PMC - PubMed
    1. van Swieten J. C. & Grossman M. FTD/ALS families are no longer orphaned: the C9ORF72 story. Neurology 79, 962–964 (2012). - PubMed
    1. Donnelly C. J., Grima J. C. & Sattler R. Aberrant RNA homeostasis in amyotrophic lateral sclerosis: potential for new therapeutic targets? Neurodegener. Dis. Manag. 4, 417–437 (2014). - PMC - PubMed
    1. Haeusler A. R. et al. C9orf72 nucleotide repeat structures initiate molecular cascades of disease. Nature 507, 195–200 (2014). - PMC - PubMed

MeSH terms