. 2017 Jan;42(1):306-319.
doi: 10.1007/s11064-016-1855-7. Epub 2016 Mar 15.

Altered Expression of Human Mitochondrial Branched Chain Aminotransferase in Dementia with Lewy Bodies and Vascular Dementia

Affiliations

Altered Expression of Human Mitochondrial Branched Chain Aminotransferase in Dementia with Lewy Bodies and Vascular Dementia

Emma L Ashby et al. Neurochem Res. 2017 Jan.

Abstract

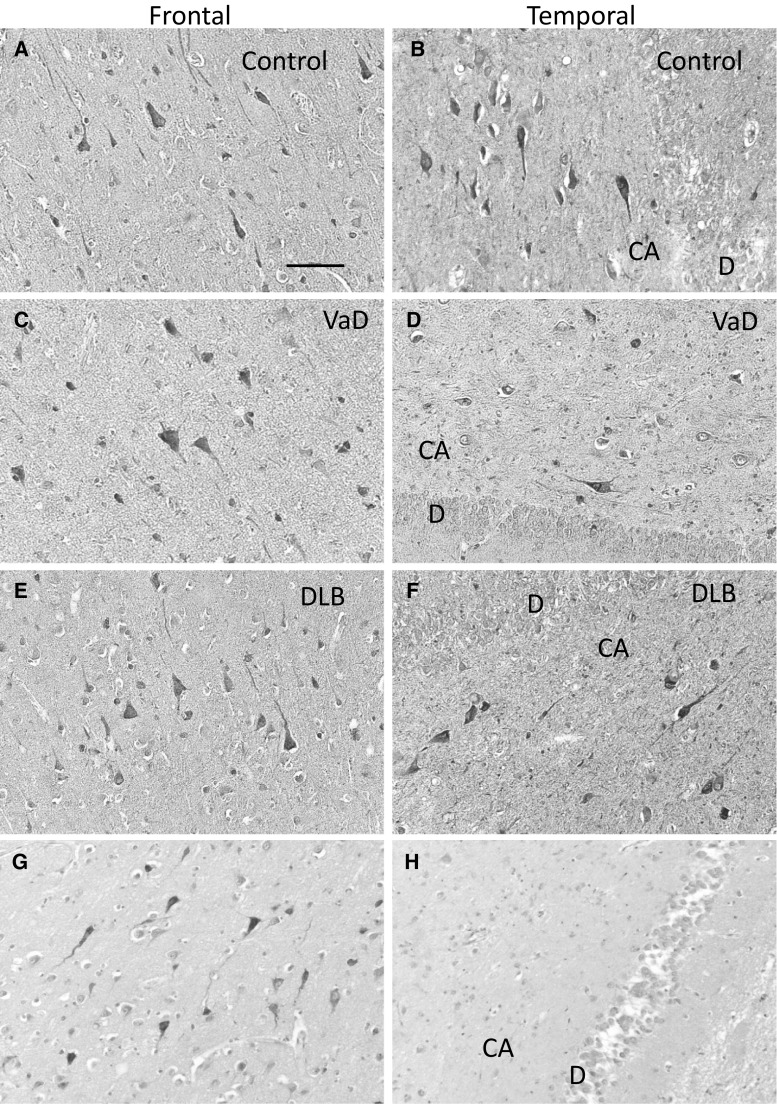
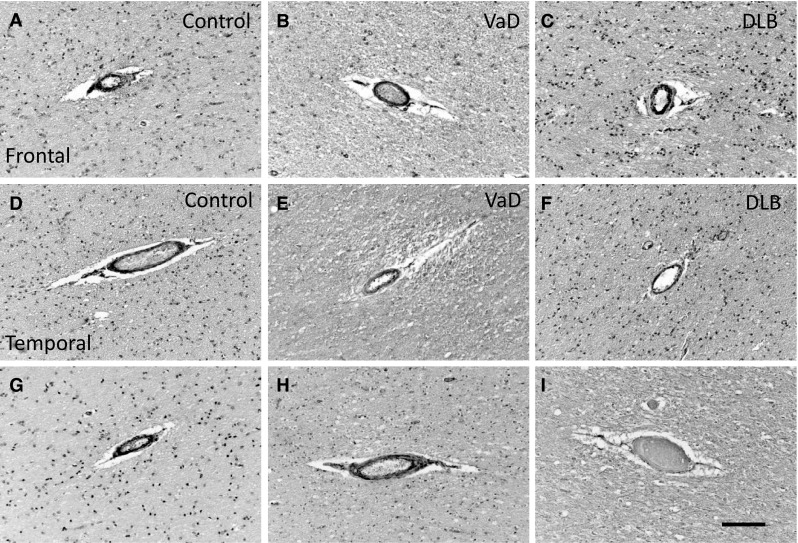
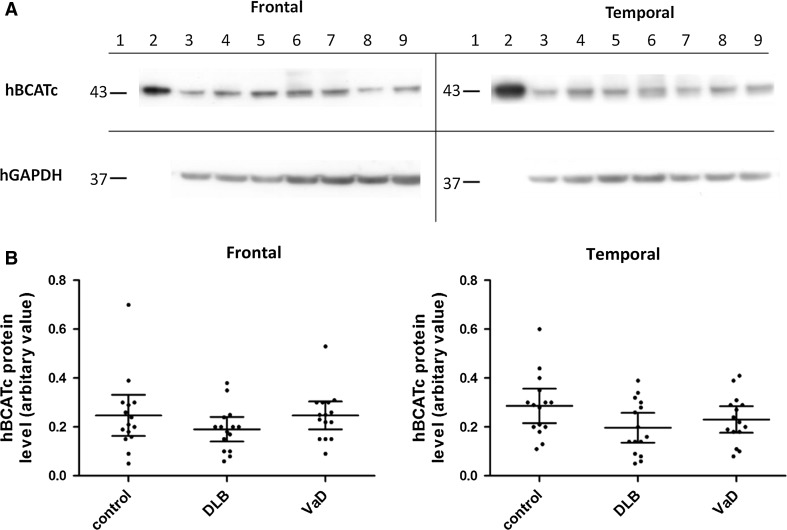
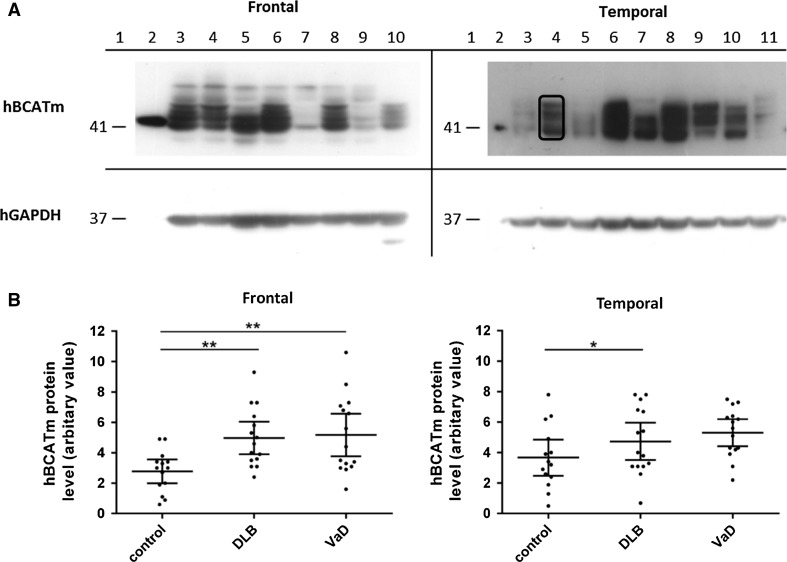
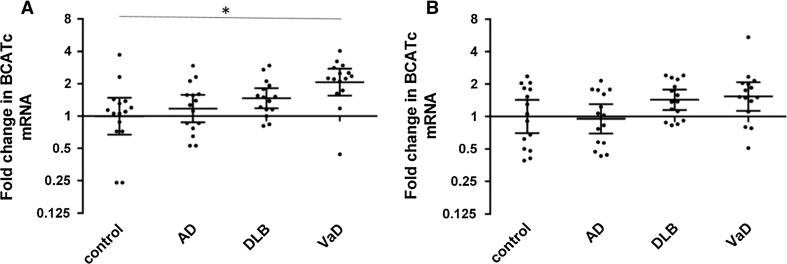
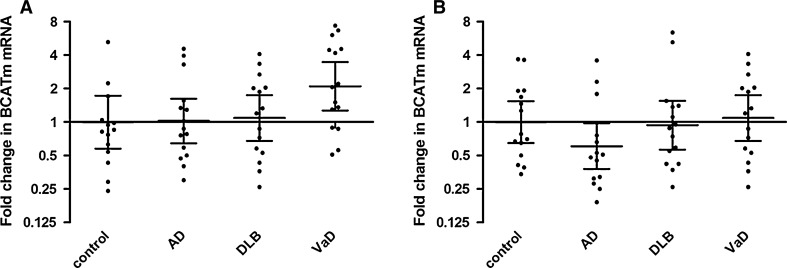
Cytosolic and mitochondrial human branched chain aminotransferase (hBCATc and hBCATm, respectively) play an integral role in brain glutamate metabolism. Regional increased levels of hBCATc in the CA1 and CA4 region of Alzheimer's disease (AD) brain together with increased levels of hBCATm in frontal and temporal cortex of AD brains, suggest a role for these proteins in glutamate excitotoxicity. Glutamate toxicity is a key pathogenic feature of several neurological disorders including epilepsy associated dementia, AD, vascular dementia (VaD) and dementia with Lewy bodies (DLB). To further understand if these increases are specific to AD, the expression profiles of hBCATc and hBCATm were examined in other forms of dementia including DLB and VaD. Similar to AD, levels of hBCATm were significantly increased in the frontal and temporal cortex of VaD cases and in frontal cortex of DLB cases compared to controls, however there were no observed differences in hBCATc between groups in these areas. Moreover, multiple forms of hBCATm were observed that were particular to the disease state relative to matched controls. Real-time PCR revealed similar expression of hBCATm mRNA in frontal and temporal cortex for all cohort comparisons, whereas hBCATc mRNA expression was significantly increased in VaD cases compared to controls. Collectively our results suggest that hBCATm protein expression is significantly increased in the brains of DLB and VaD cases, similar to those reported in AD brain. These findings indicate a more global response to altered glutamate metabolism and suggest common metabolic responses that might reflect shared neurodegenerative mechanisms across several forms of dementia.

Keywords: Alzheimer’s disease; Branched chain aminotransferase; Dementia with Lewy body; Glutamate; Vascular dementia; hBCATc; hBCATm.


Figures

Fig. 1
Fig. 1
Positive immunostaining for hBCATc in neuronal cells of vascular dementia and dementia with Lewy bodies. Immunolabelling with anti-hBCATc (Insight Biotechnology limited) showed that hBCATc is localised to cortical neurons in frontal and temporal cortex of control (a, b), vascular dementia (VaD) (c, d) and dementia with Lewy bodies (DLB) cases (e, f). Immunolabelling with anti-hBCATc (Abcam) confirmed this neuronal distribution in frontal cortex of the control case (g). The specificity of labelling human brain tissue was demonstrated by the lack of signal after pre-incubation of anti-hBCATc (Insight Biotechnologies limited) with 200-fold molar excess of immunising peptide (i, control case). The scale bar represents 100 µm in ah. DG dentate gyrus
Fig. 2
Fig. 2
Positive immunostaining for hBCATm in endothelial cells of vascular dementia and dementia with Lewy bodies. Immunolabelling in frontal (ac) and temporal cortex (df) with anti-hBCATm (Insight Biotechnology limited) showed that hBCATm is present in the walls of some cortical arterioles in control (a, d), vascular dementia (VaD) (b, e) and dementia with Lewy bodies (DLB) cases (c, f). Immunolabelling with anti-hBCATm (Abcam) confirmed this vascular distribution in frontal (g) and temporal cortex (h) of a control case. The specificity of labelling of human brain tissue was demonstrated by the lack of signal after preincubation of anti-hBCATm (Insight Biotechnologies limited) with 200-fold molar excess of immunising peptide (i, control case). The scale bar represents 100 µm
Fig. 3
Fig. 3
hBCATc protein in frontal and temporal cortex. a (frontal and temporal) Representative Western blot probed with anti-hBCATc, followed by anti-GAPDH. For all Western blots, Lane 1 molecular weight markers, Lane 2 overexpressed purified hBCATc, Lanes 3–4 control, Lanes 5–7 dementia with Lewy bodies (DLB) and Lanes 8–9 vascular dementia (VaD) homogenates. Anti-hBCATc antibody detected a single band of 43 kDa from overexpressed hBCATc protein and in brain homogenates. b Graphs showing hBCATc protein level in frontal and temporal cortex in control, DLB and VaD. The horizontal bars indicate the mean and 95 % confidence intervals for each group and each point represents an individual brain
Fig. 4
Fig. 4
hBCATm protein in frontal and temporal cortex. a representative Western blot probed with anti-hBCATm, followed by GAPDH. Densitometry measured the bands specific for hBCATm, as indicated on the blot. For all Western blots, Lane 1 molecular weight markers and Lane 2 overexpressed hBCATm, Frontal: Lanes 3–4 VaD, Lanes 5–6 DLB and Lanes 7–9 control homogenates; Lane 10 AD, Temporal: Lanes 3, 5, 11 control, Lanes 4, 6, 7 DLB and Lanes 8–10 VaD. Anti-hBCATm antibody detected a single band of 41 kDa from overexpressed hBCATm protein and in frontal and temporal homogenates bands between 41 and 52 kDa. b Graphs showing hBCATm protein level in frontal and temporal cortex in control, DLB and VaD. The horizontal bars indicate the mean and 95 % confidence intervals for each group and each point represents an individual brain
Fig. 5
Fig. 5
hBCATc mRNA in the frontal and temporal cortex. hBCATc mRNA was measured by real-time PCR in the frontal (a) and temporal cortex (b) of control, Alzheimer’s disease (AD), dementia with Lewy bodies (DLB) and vascular dementia (VaD) cases. Fold change in BCAT1 expression in relation to GAPDH was calculated using the 2−ΔΔCt method. Graphs show individual data points along with geometric mean and 95 % confidence intervals for each group on a logarithmic scale to the base 2
Fig. 6
Fig. 6
hBCATm mRNA in the frontal and temporal cortex. hBCATm mRNA was measured by real-time PCR in the frontal (a) and temporal cortex (b) of control, Alzheimer’s disease (AD), dementia with Lewy bodies (DLB) and vascular dementia (VaD) cases. Fold change in BCAT2 expression in relation to GAPDH was calculated using the 2−ΔΔCt method. Graphs show individual data points along with the geometric mean and 95 % confidence intervals for each group on a logarithmic scale to the base 2. hBCATm mRNA expression levels were not significantly different between the groups in either of the brain regions

References

    1. Alzheimer’s Association Alzheimer’s disease facts and figures. Alzheimers Dement. 2015;11(3):332–384. doi: 10.1016/j.jalz.2015.02.003. - DOI - PubMed
    1. Merz PA, Wisniewski HM, Somerville RA, Bobin SA, Masters CL, Iqbal K. Ultrastructural morphology of amyloid fibrils from neuritic and amyloid plaques. Acta Neuropathol. 1983;60(1–2):113–124. doi: 10.1007/BF00685355. - DOI - PubMed
    1. Braak H, Braak E, Bohl J. Staging of Alzheimer-related cortical destruction. Eur Neurol. 1993;33(6):403–408. doi: 10.1159/000116984. - DOI - PubMed
    1. Danbolt NC. Glutamate uptake. Prog Neurobiol. 2001;65(1):1–105. doi: 10.1016/S0301-0082(00)00067-8. - DOI - PubMed
    1. Amaral MD, Pozzo-Miller L. The dynamics of excitatory synapse formation on dendritic spines. Cell Sci. 2009;5(4):19–25. - PMC - PubMed