. 2016 Mar 15:2016:bav127.
doi: 10.1093/database/bav127. Print 2016.

ncRNA orthologies in the vertebrate lineage

Affiliations

ncRNA orthologies in the vertebrate lineage

Miguel Pignatelli et al. Database (Oxford). .

Abstract

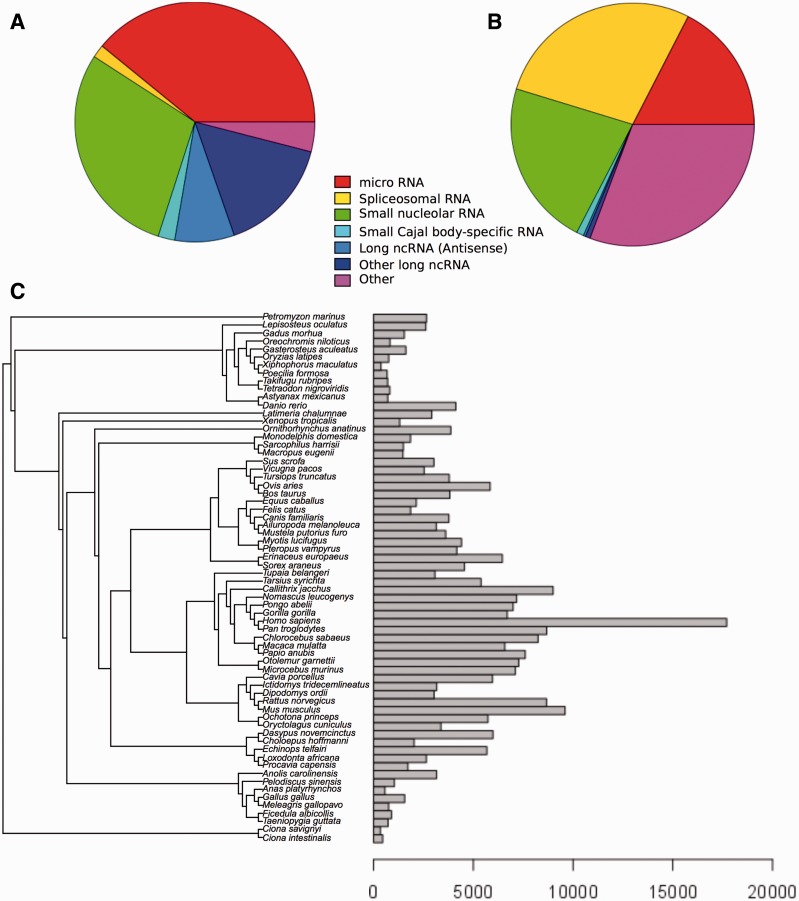
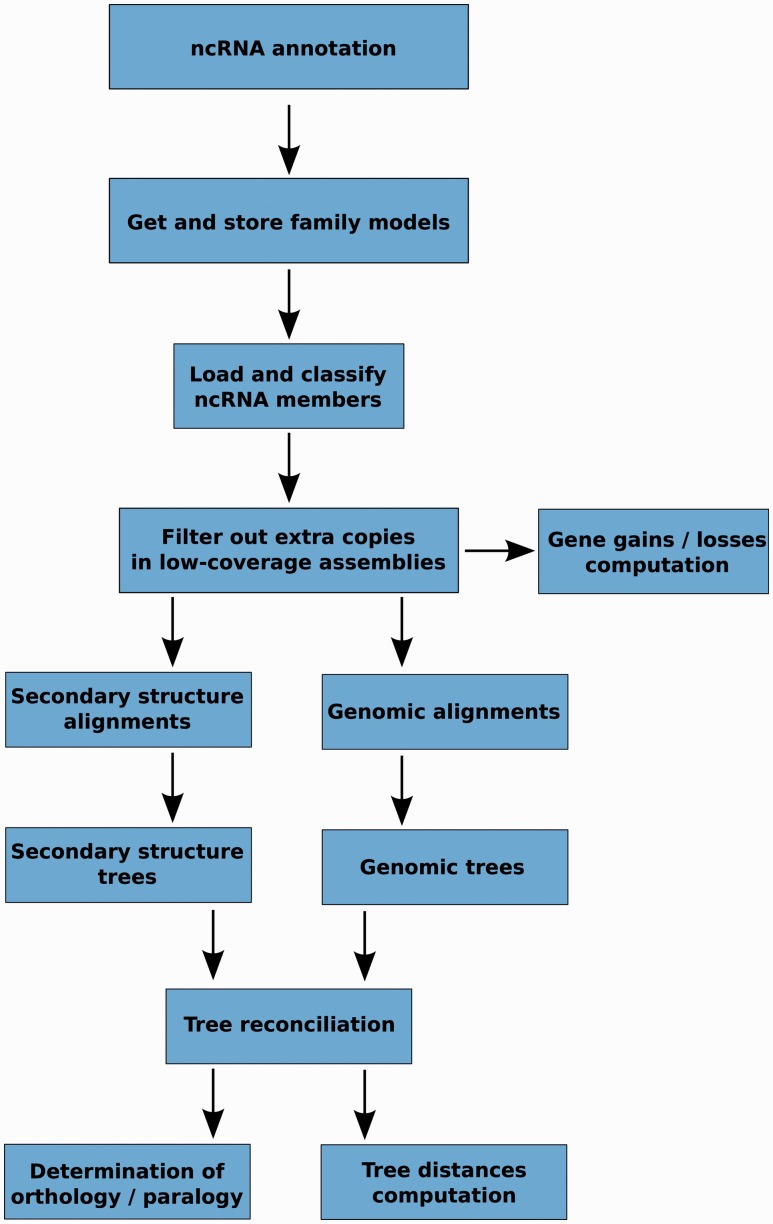
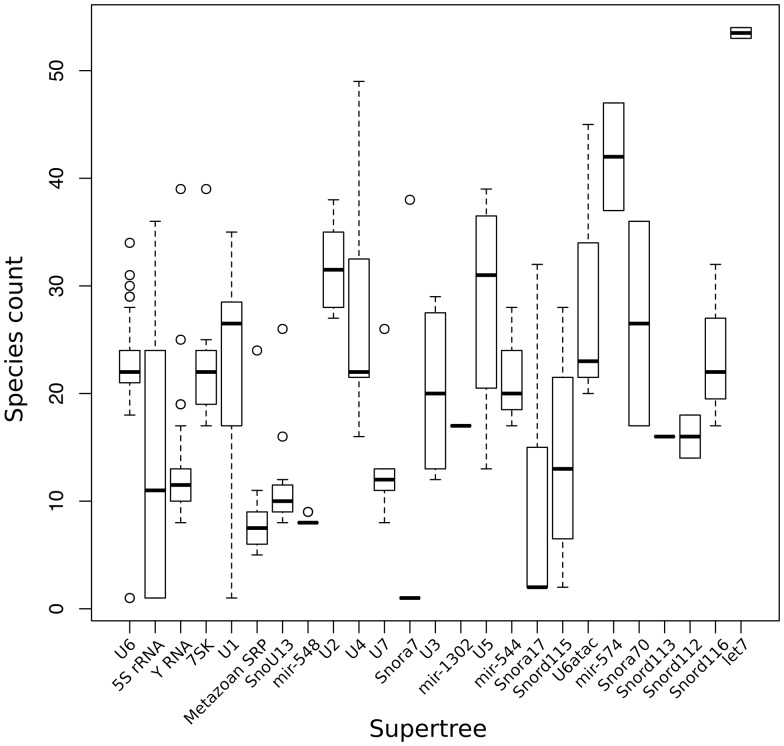
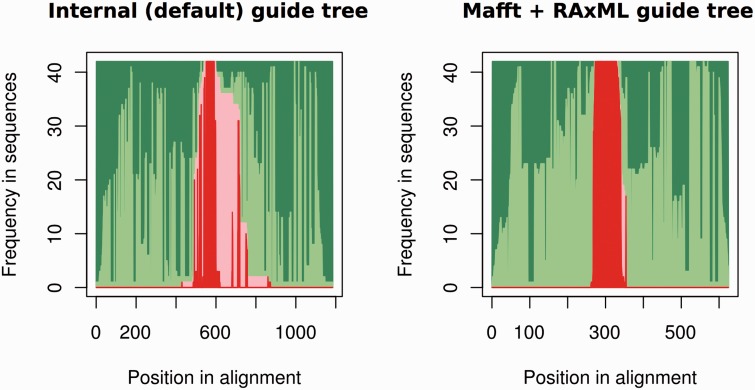
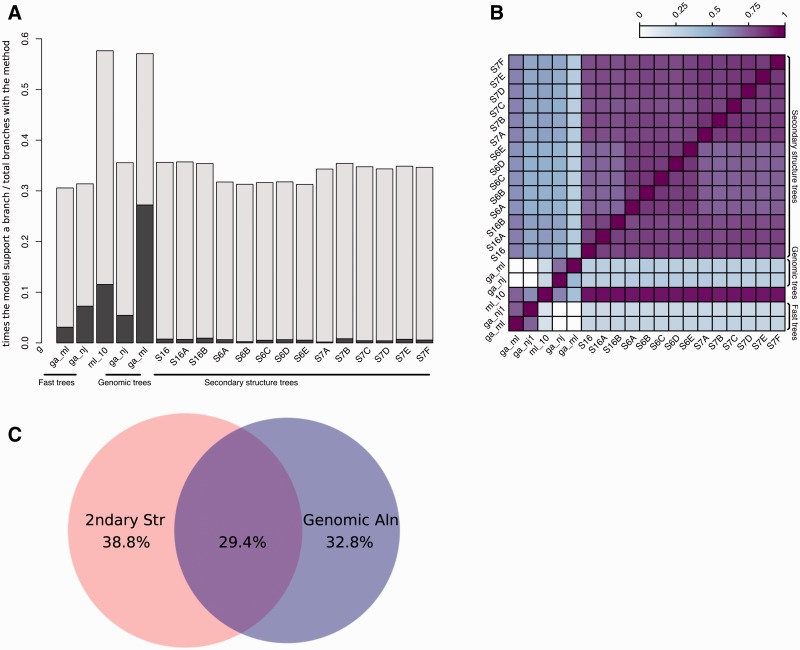
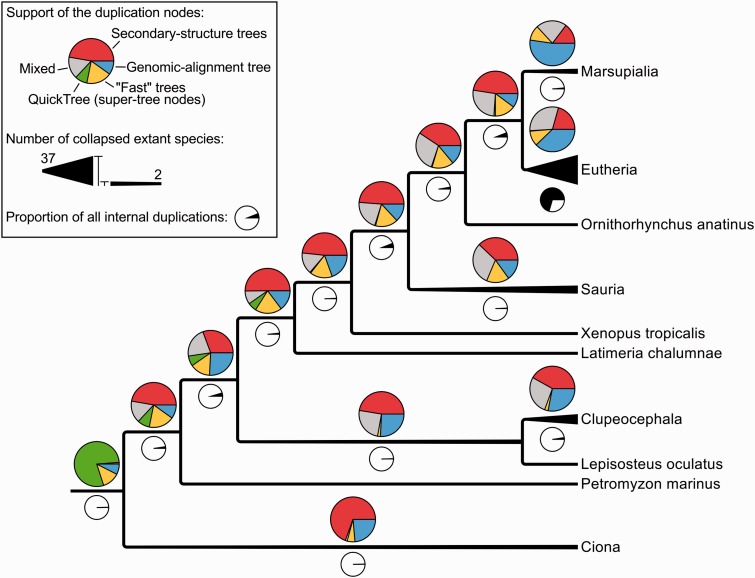
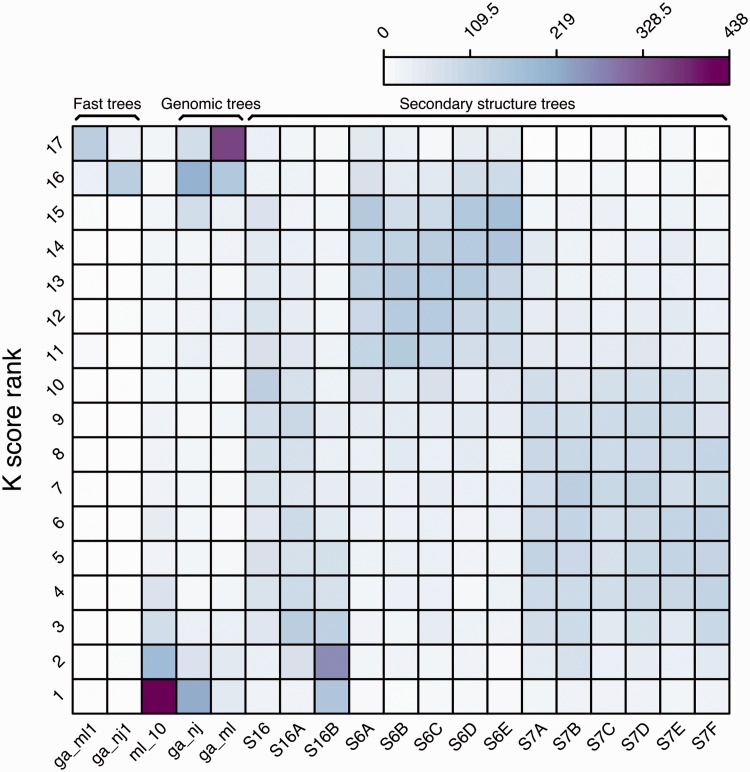
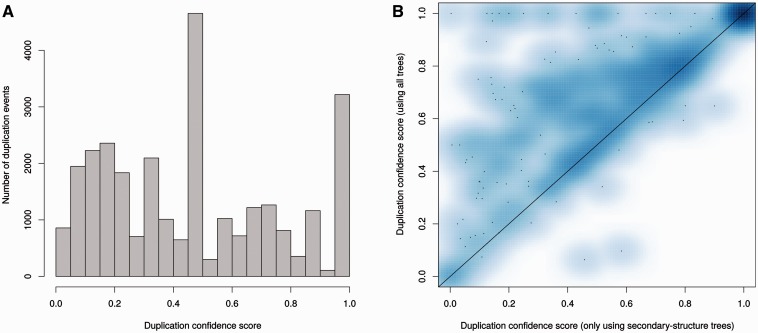
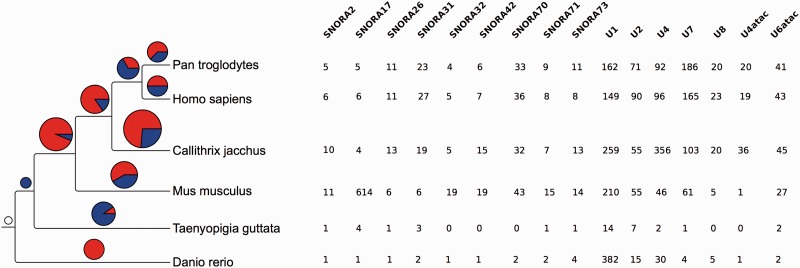
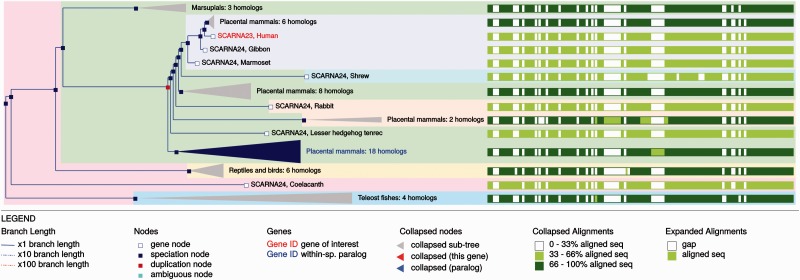
Annotation of orthologous and paralogous genes is necessary for many aspects of evolutionary analysis. Methods to infer these homology relationships have traditionally focused on protein-coding genes and evolutionary models used by these methods normally assume the positions in the protein evolve independently. However, as our appreciation for the roles of non-coding RNA genes has increased, consistently annotated sets of orthologous and paralogous ncRNA genes are increasingly needed. At the same time, methods such as PHASE or RAxML have implemented substitution models that consider pairs of sites to enable proper modelling of the loops and other features of RNA secondary structure. Here, we present a comprehensive analysis pipeline for the automatic detection of orthologues and paralogues for ncRNA genes. We focus on gene families represented in Rfam and for which a specific covariance model is provided. For each family ncRNA genes found in all Ensembl species are aligned using Infernal, and several trees are built using different substitution models. In parallel, a genomic alignment that includes the ncRNA genes and their flanking sequence regions is built with PRANK. This alignment is used to create two additional phylogenetic trees using the neighbour-joining (NJ) and maximum-likelihood (ML) methods. The trees arising from both the ncRNA and genomic alignments are merged using TreeBeST, which reconciles them with the species tree in order to identify speciation and duplication events. The final tree is used to infer the orthologues and paralogues following Fitch's definition. We also determine gene gain and loss events for each family using CAFE. All data are accessible through the Ensembl Comparative Genomics ('Compara') API, on our FTP site and are fully integrated in the Ensembl genome browser, where they can be accessed in a user-friendly manner. Database URL: http://www.ensembl.org.


Figures

Figure 1.
Figure 1.
Distribution of Ensembl ncRNA genes in the Rfam database. (A) Distribution of Ensembl ncRNA gene families present in Rfam by family type. (B) Distribution of Ensembl ncRNA genes present in Rfam by family type. (C) Distribution of ncRNA genes by species.
Figure 2.
Figure 2.
Schematic representation of the main steps in the ncRNA tree analysis pipeline.
Figure 3.
Figure 3.
Distribution of number of species in the different sub-trees after splitting the super-trees.
Figure 4.
Figure 4.
Summary of the PRANK alignment for the mir-652 gene family (17 genes) using either PRANK (default internal tree) or MAFFT + RAxML to build the guide tree. For each position in the alignment (x axis), we represent the fraction of gaps in flanking regions (dark green), aligned flanking sequence (light green), gaps in the ncRNA regions (light red) and aligned ncRNA regions (dark red). The figure shows, using MAFFT + RAxML to produce the guide tree, how we obtain an alignment where the ncRNA and the flanking regions are well segregated.
Figure 5.
Figure 5.
Analysis of tree reconciliation. (A) Intermediate tree support for each branch in the final tree. For each final branch in the final gene trees, the number of times a given intermediate tree supports a branch is calculated and divided by the total times that tree appears. The dark regions of each bar indicate the fraction of times the branch is supported only by that tree. (B) Heatmap representing the overlap between model support. The support for each model in all final branches in the final trees is divided by the union of models supporting them, i.e. when two models support the same final branches, this ratio is 1 and when no overlap is found, this ratio is 0. (C) Venn diagram showing the overlap between branches supported by trees based on secondary structure or genomic sequences. Fast trees are included in the corresponding category.
Figure 6.
Figure 6.
Simplified species-tree showing the support of all the internal duplications (coloured pie charts) and their numbers (black and white pie charts). ‘Mixed’ signifies that the duplication is supported by multiple kinds of intermediate trees, as opposite to the other labels such as ‘Secondary-structure trees’ which indicate that a duplication has been identified by a single kind of intermediate trees.
Figure 7.
Figure 7.
Ranking frequency of the different intermediate trees compared with the merged final tree based on their K tree scores.
Figure 8.
Figure 8.
Analysis of duplication confidence scores in the resulting trees. (A) Distribution of confidence scores for non-species specific duplications determined by the ncRNA analysis pipeline including secondary structure trees, genomic-based trees and fast trees in Ensembl release 82. (B) Improvement of confidence scores for all duplications when genomic based intermediate trees are added to secondary structure-based trees in the merging step. Each data point in the heat map represents the average scores for a family.
Figure 9.
Figure 9.
Gene family expansions and contractions. The tree on the left shows the species used in the gene family evolution of ncRNA trees. The pie charts show the number of gene families expanded (red) and contracted (blue) in each node of the tree. The size of the pie chart is proportional to the number of families that have expanded or contracted. The table on the right shows the families expanded in the mammal lineage. The numbers indicate the number of genes in each extant species.
Figure 10.
Figure 10.
Example gene tree displayed in the Ensembl genome browser.

Similar articles

Cited by

References

    1. The ENCODE Project Consortium (2012) An integrated encyclopedia of DNA elements in the human genome. Nature, 489, 57–74. - PMC - PubMed
    1. Washietl S., Pedersen J.S., Korbel J.O. et al. (2007) Structured RNAs in the ENCODE selected regions of the human genome. Genome Res., 17, 852–864. - PMC - PubMed
    1. Kishore S., Stamm S. (2006) The snoRNA HBII-52 regulates alternative splicing of the serotonin receptor 2C. Science, 311, 230–232. - PubMed
    1. Billi A.C., Freeberg M.A., Kim J.K. (2012) piRNAs and siRNAs collaborate in Caenorhabditis elegans genome defense. Genome Biol., 13, 164. - PMC - PubMed
    1. Lee H.C., Gu W., Shirayama M. et al. (2012) C. elegans piRNAs mediate the genome-wide surveillance of germline transcripts. Cell, 150, 78–87. - PMC - PubMed

Publication types

Substances

LinkOut - more resources