Effectiveness of citrate buffer-fluoride mixture in Terumo tubes as an inhibitor of in vitro glycolysis
- PMID: 26981020
- PMCID: PMC4783092
- DOI: 10.11613/BM.2016.006
Effectiveness of citrate buffer-fluoride mixture in Terumo tubes as an inhibitor of in vitro glycolysis
Abstract
Introduction: Glycolysis affects glucose determination in vitro. The placement of sample tubes in ice-water slurry with plasma separation within 30 minutes is recommended, or alternatively the use of a glycolysis inhibitor. The aim of our two-steps study was to evaluate which Terumo tube is best for glucose determination in routine clinical setting.
Materials and methods: In the first study, blood from 100 volunteers was collected into lithium heparin (LH), NaF/Na heparin (FH) and NaF/citrate buffer/Na2EDTA (FC-Mixture) tubes. LH sample was treated as recommended and considered as reference, while FH and FC-Mixture samples were aliquoted, maintained at room temperature (RT) for 1, 2 and 4 hours; centrifuged and plasma analysed in triplicate. In the second study, samples from 375 volunteers were collected in LH, FH and FC-Mixture tubes and held at RT before centrifugation from 10 to 340 minutes, depending on each laboratory practice. Samples were analysed in one analytical run.
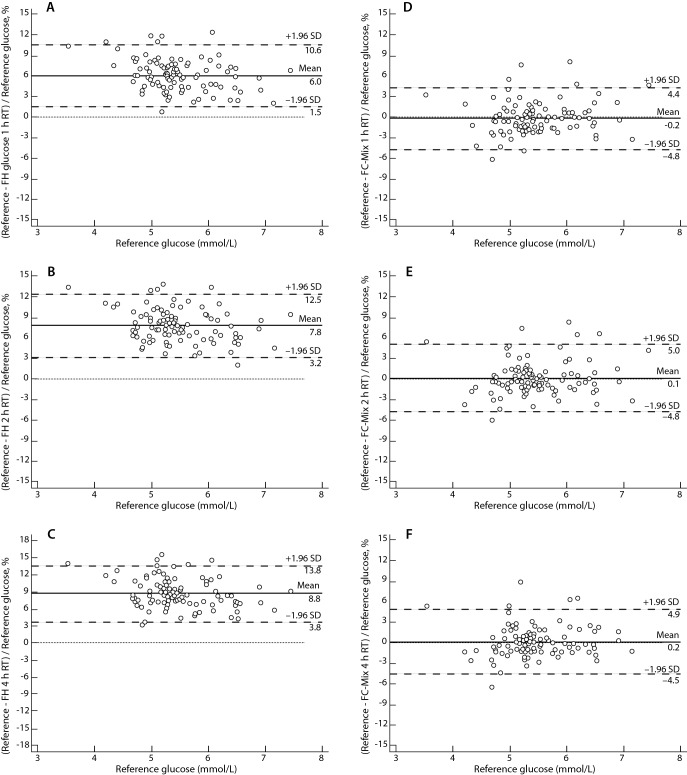
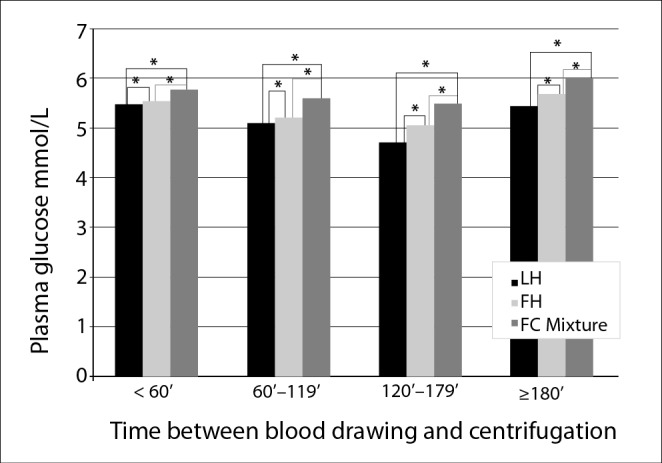
Results: In the first study, FH glucose concentrations were 5.15 ± 0.66 mmol/L, 5.05 ± 0.65 mmol/L and 5.00 ± 0.65 mmol/L (P < 0.001) in tubes stored at RT for 1, 2 and 4 hours, respectively. Mean biases in all time points exceeded the analytical goal for desirable bias based on biological variation criteria. FC-Mixture glucose concentrations were 5.48 ± 0.65 mmol/L, 5.46 ± 0.6 mmol/L and 5.46 ± 0.64 mmol/L in tubes stored at RT for 1, 2 and 4 hours, respectively. Mean biases for FC-Mixture glucose in all time points reached optimal analytical goals. In the second study, the biases for LH and FH glucose compared to reference FC-Mixture glucose exceeded the preset analytical goals, regardless of the blood collection to centrifugation time interval.
Conclusions: FC-mixture tubes glucose concentrations were preserved up to 4h storage at RT. We confirmed that NaF alone does not allow immediate glycolysis inhibition in real life pre-centrifugation storage conditions (up to 340 minutes). FC-Mixture should be used exclusively for glucose determination in laboratories unable to implement the recommended blood samples' treatment.
Keywords: citrate acidification; glucose; pre-analytical phase; sodium fluoride; stability.
Conflict of interest statement
None declared.
Figures
References
-
- Sacks DB. Carbohydrates. In: Burtis CA, Ashwood ER, Bruns DE, eds. Tietz textbook of clinical chemistry and molecular diagnostics, 5th ed. St. Louis: Elsevier Saunders, 2012. p.709-30.
MeSH terms
Substances
LinkOut - more resources
Full Text Sources
Other Literature Sources
Medical
Miscellaneous