. 2016 Mar 15:8:32.
doi: 10.1186/s13148-016-0195-4. eCollection 2016.

Dynamic interplay between locus-specific DNA methylation and hydroxymethylation regulates distinct biological pathways in prostate carcinogenesis

Affiliations

Dynamic interplay between locus-specific DNA methylation and hydroxymethylation regulates distinct biological pathways in prostate carcinogenesis

Shivani N Kamdar et al. Clin Epigenetics. .

Abstract

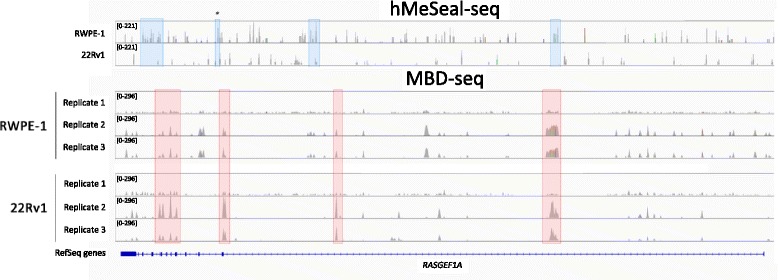
Background: Despite the significant global loss of DNA hydroxymethylation marks in prostate cancer tissues, the locus-specific role of hydroxymethylation in prostate tumorigenesis is unknown. We characterized hydroxymethylation and methylation marks by performing whole-genome next-generation sequencing in representative normal and prostate cancer-derived cell lines in order to determine functional pathways and key genes regulated by these epigenomic modifications in cancer.

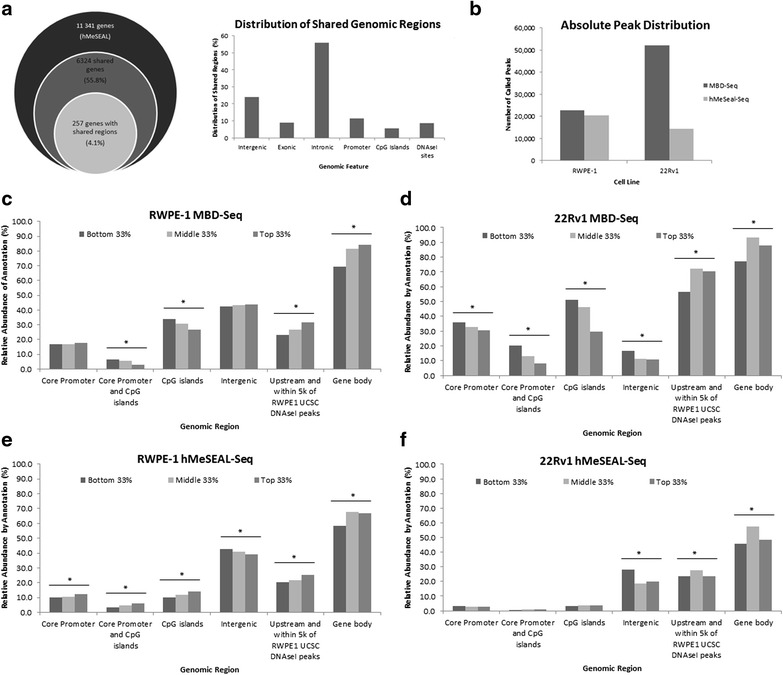
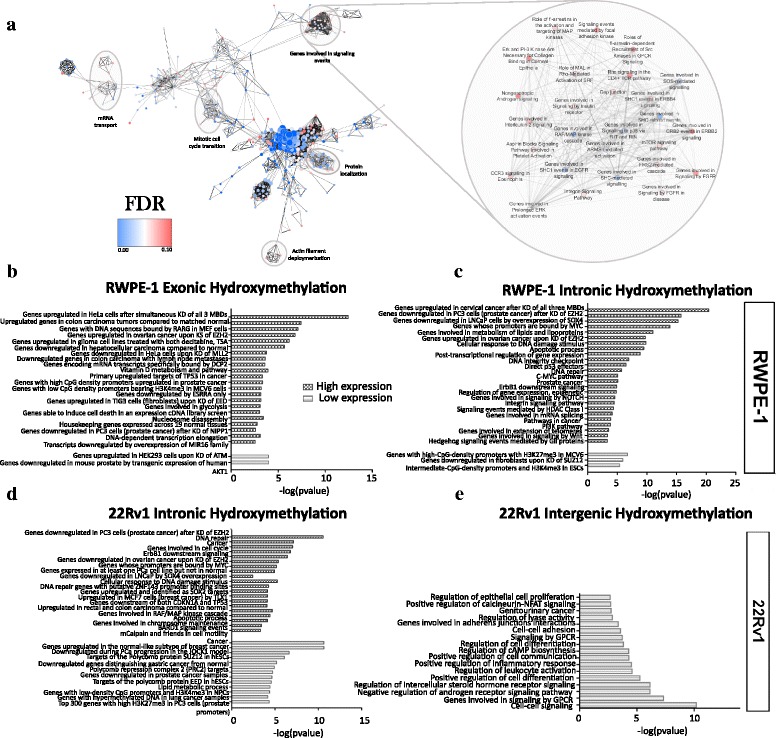
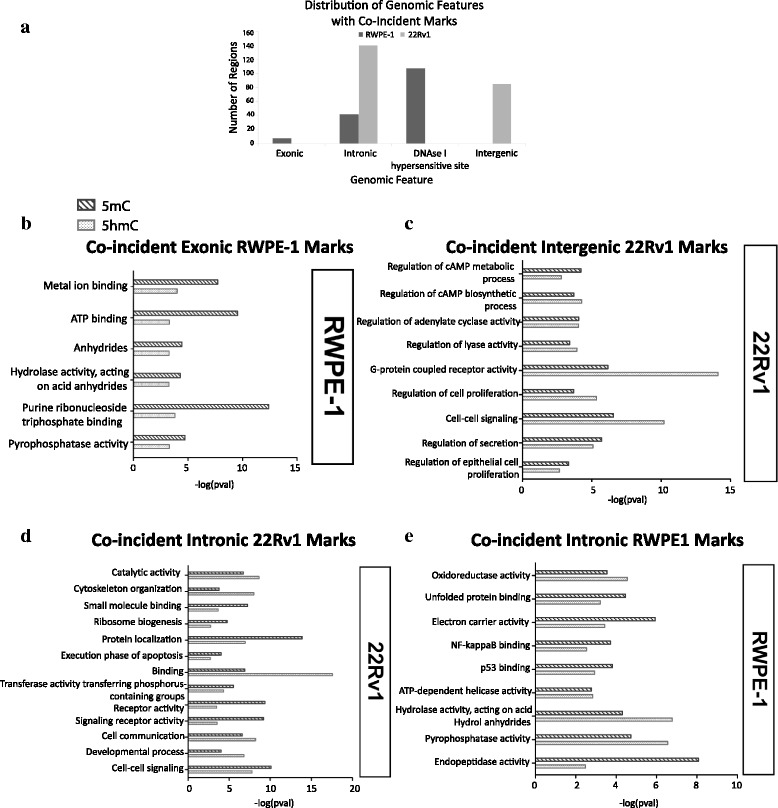
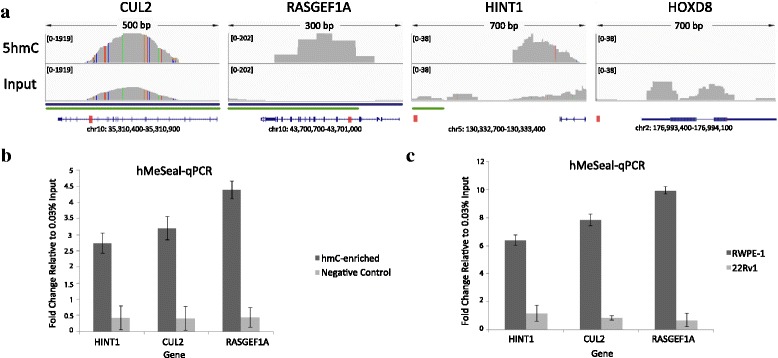
Results: Our cell line model shows disruption of hydroxymethylation distribution in cancer, with global loss and highly specific gain in promoter and CpG island regions. Significantly, we observed locus-specific retention of hydroxymethylation marks in specific intronic and intergenic regions which may play a novel role in the regulation of gene expression in critical functional pathways, such as BARD1 signaling and steroid hormone receptor signaling in cancer. We confirm a modest correlation of hydroxymethylation with expression in intragenic regions in prostate cancer, while identifying an original role for intergenic hydroxymethylation in differentially expressed regulatory pathways in cancer. We also demonstrate a successful strategy for the identification and validation of key candidate genes from differentially regulated biological pathways in prostate cancer.

Conclusions: Our results indicate a distinct function for aberrant hydroxymethylation within each genomic feature in cancer, suggesting a specific and complex role for the deregulation of hydroxymethylation in tumorigenesis, similar to methylation. Subsequently, our characterization of key cellular pathways exhibiting dynamic enrichment patterns for methylation and hydroxymethylation marks may allow us to identify differentially epigenetically modified target genes implicated in prostate cancer tumorigenesis.

Keywords: 5-Hydroxymethylcytosine; 5-Methylcytosine; Cell lines; Integrative analysis; Prostate cancer; Whole-genome.


Figures

Fig. 1
Fig. 1
Locus-specific differential distribution of methylation and hydroxymethylation in normal prostate versus prostate cancer cell lines. Linear representation of hMeSeal-seq (top) and MBD-seq (bottom) peaks in representative normal prostate (RWPE-1) or prostate cancer (22Rv1) cells across the representative gene RasGEF domain family, member 1a (RASGEF1A). Top: generalized and locus-specific hypohydroxymethylation in 22Rv1. Blue boxes indicate representative regions exhibiting strong hydroxymethylation peaks in RWPE-1 and weak or absent hydroxymethylation peaks in 22Rv1. Asterisk indicates hydroxymethylated region validated by hMeSeal-qPCR testing. Bottom: locus-specific differential methylation between cell lines. Red boxes indicate representative regions showing strong methylation peaks in 22Rv1 and weaker peaks in RWPE-1. Note that certain regions also exhibit locus-specific methylation in RWPE-1 and not in 22Rv1
Fig. 2
Fig. 2
Correlation between locus-specific methylation or hydroxymethylation and gene expression. a Validation of hMeSeal-Seq results by hMeDIP-Seq. Left: 62.6 % of genes detected as hydroxymethylated in RWPE-1 by hMeSeal were also detected as hydroxymethylated using hMeDIP, while 2.3 % of peaks from these genes were called in exactly the same chromosomal location using both methods. Right: genomic feature distribution for peaks called in the same regions in both hMeDIP- and hMeSeal-seq. Some features may overlap each other, and thus one peak may be accounted for more than once. b Total peaks called from sequencing data in normal and prostate cancer cell lines. Peaks called across three replicates for MBD-Seq or within one single replicate for hMeSeal-seq. cf Differentially methylated (c, d) and differentially hydroxymethylated (e, f) regions for both cell lines stratified by genomic feature. Bar graphs depict the relative abundance of each mark within each of three expression tiers from microarray analysis. Asterisks represent significant p values (p < 0.05, chi-square test for trend) indicating correlation between the presence of 5mC or 5hmC marks in a given region and gene expression within each cell line. Upward trend of bars, when significant, indicates a positive correlation of a locus-specific mark with gene expression. Significant downward trend indicates negative correlation
Fig. 3
Fig. 3
Pathway regulation by methylation and hydroxymethylation marks in normal prostate and prostate cancer. a Representative example of an enrichment map generated using Cytoscape depicting annotations significantly enriched for genes exhibiting intronic hydroxymethylation and highest tier expression levels in 22Rv1 alone as compared to all genes detected in both cell lines via hMeSeal-Seq. Annotated using the GREAT hypergeometric test over regions (p value < 0.05, FDR < 0.1, Jaccard’s similarity coefficient < 0.25). Left: select clusters of related pathways (nodes) in the enrichment map are highlighted (clusters identified using MCODE). Right: zoom in to signaling pathway enrichment map cluster. Below: pathway enrichment annotations from GREAT for hydroxymethylation within RWPE-1 cells, overlapping (b) exonic or (c) intronic regions and hydroxymethylation within 22Rv1 overlapping (d) intronic or (e) intergenic regions. Pathways further represented by genes within the highest (high expression) and lowest tier of expression (low expression)
Fig. 4
Fig. 4
Locus-specific co-enrichment of methylation and hydroxymethylation marks in normal prostate versus prostate cancer. a Genomic distribution of 5hmC marks exhibiting co-incidence with 5mC in normal prostate versus prostate cancer cells. Co-incident marks were defined as precise regions within the same cell line containing both 5mC and 5hmC marks which exhibited at least partial overlap. be Pathway enrichment annotations from GREAT for co-incident marks in (b) RWPE-1 exonic regions, (c) 22Rv1 intergenic regions, or intronic regions in (d) 22Rv1 or (e) RWPE-1 cells. Log p values for methylation marks (top) and hydroxymethylation marks (bottom) are shown
Fig. 5
Fig. 5
Validation of differentially hydroxymethylated regions (DHMRs) via hMeSeal-qPCR. a Top: IGV Genome Browser representation of absolute hydroxymethylation peaks called in single replicate from hMeSeal-seq data within regions showing hydroxymethylation in both hMeSeal- and hMeDIP-seq and compared to unenriched input control for three representative genes for validation: CUL2, RASGEF1a, and HINT1, and HOXD8 negative control. Peak strength indicated by height of representative peak within replicate or input control (scale shown in square brackets). Colored vertical bars within peaks represent differences between sequenced bases and the hg19 reference genome. Bottom: Blue horizontal bars indicate the presence of introns. Green horizontal bars indicate CGIs. Red boxes indicate the position of the hMeSeal-qPCR amplified segment depicted relative to the overall location of the gene (figure not to scale). Gene diagram adapted from UCSC Genome Browser. b Validation of hydroxymethylation gene enrichment for RWPE-1. Enrichment of hydroxymethylation detected via hMeSeal-qPCR for candidate genes, CUL2, RASGEF1a, and HINT1, within RWPE-1 compared to HOXD8 negative control and normalized relative to 0.03 % input control using the ΔΔCt method (mean values ± standard deviation, n = 3). All genes were compared to negative hMeSeal control reaction performed without UDP-azide-glucose and representing nonspecific binding. c Hydroxymethylated gene enrichment for RWPE-1 versus 22Rv1. Differential detection of genes identified as uniquely hydroxymethylated in RWPE-1, but not 22Rv1, by hMeSeal-seq via hMeSeal-qPCR compared to negative control hMeSeal reaction and normalized relative to 0.03 % input control using the ΔΔCt method (mean values ± standard deviation, n = 3)

References

    1. Van Vlodrop IJ, Niessen HE, Derks S, Baldewijns MM, van Criekinge W, Herman JG, et al. Analysis of promoter CpG island hypermethylation in cancer: location, location, location! Clin Cancer Res. 2011 - PubMed
    1. Esteller M. CpG island hypermethylation and tumor suppressor genes: a booming present, a brighter future. Oncogene. 2002;21(35):5427–5440. doi: 10.1038/sj.onc.1205600. - DOI - PubMed
    1. Sproul D, Kitchen RR, Nestor CE, Dixon JM, Sims AH, Harrison DJ, et al. Tissue of origin determines cancer-associated CpG island promoter hypermethylation patterns. Genome Biol. 2012 - PMC - PubMed
    1. Esteller M, Herman JG. Cancer as an epigenetic disease: DNA methylation and chromatin alterations in human tumours. J Pathol. 2002;196(1):1–7. doi: 10.1002/path.1024. - DOI - PubMed
    1. Vilain A, Vogt N, Dutrillaux B, Malfoy B. DNA methylation and chromosome instability in breast cancer cell lines. FEBS Lett. 1999;460(2):231–234. doi: 10.1016/S0014-5793(99)01358-7. - DOI - PubMed

Publication types

Associated data