

Bacterial Cytological Profiling (BCP) as a Rapid and Accurate Antimicrobial Susceptibility Testing Method for Staphylococcus aureus
- PMID: 26981574
- PMCID: PMC4776060
- DOI: 10.1016/j.ebiom.2016.01.020
Bacterial Cytological Profiling (BCP) as a Rapid and Accurate Antimicrobial Susceptibility Testing Method for Staphylococcus aureus
Abstract
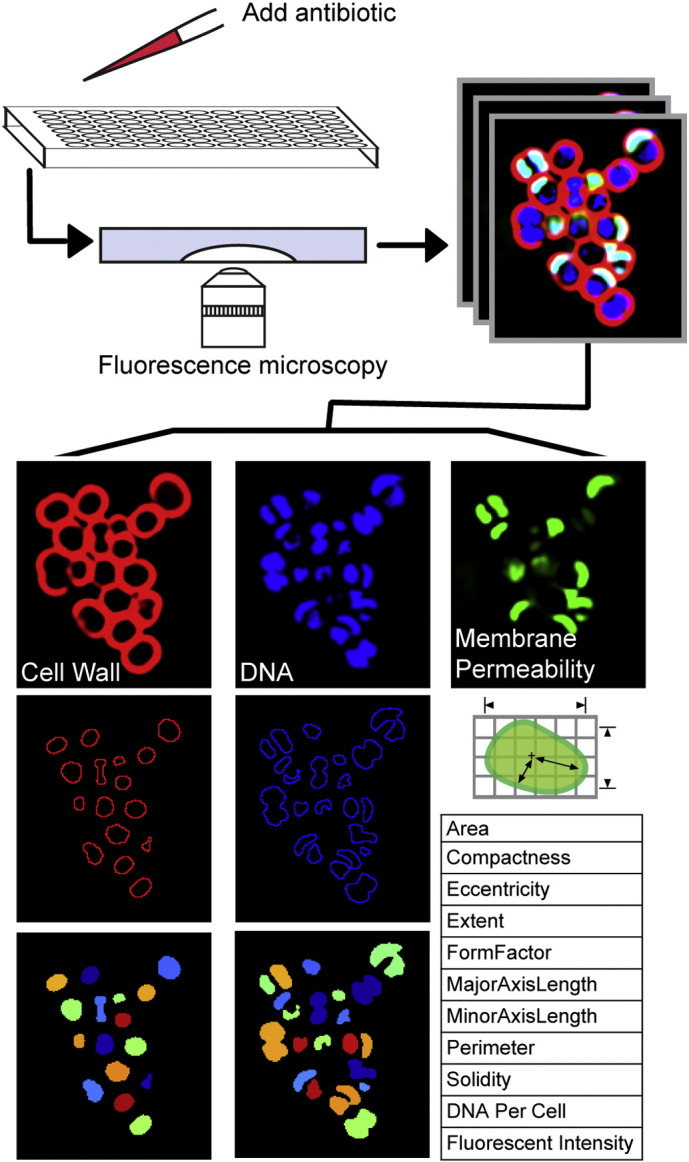
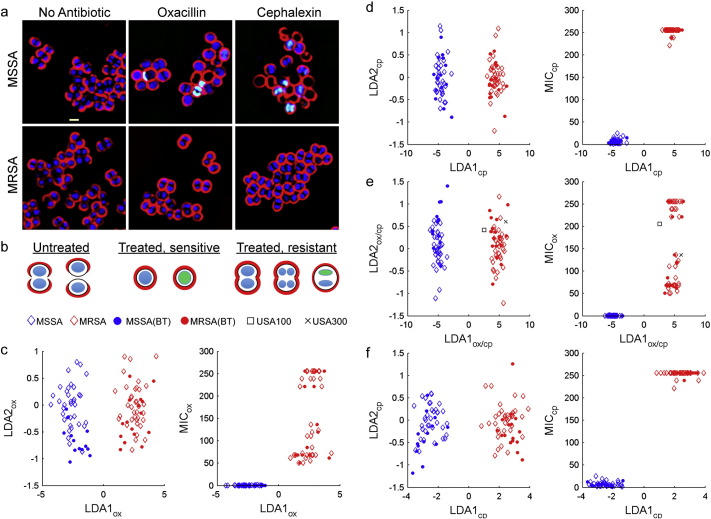
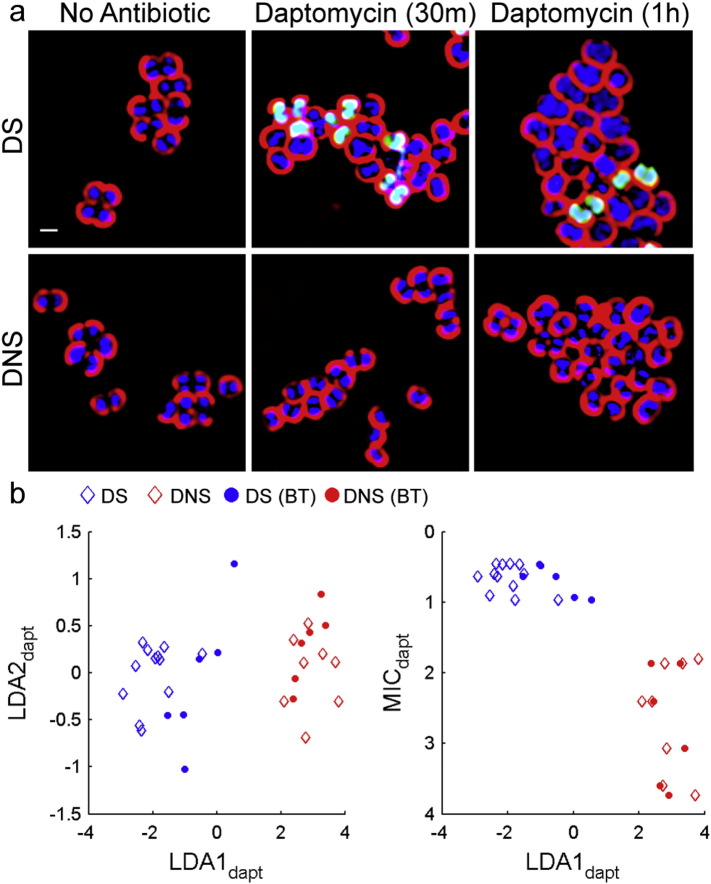
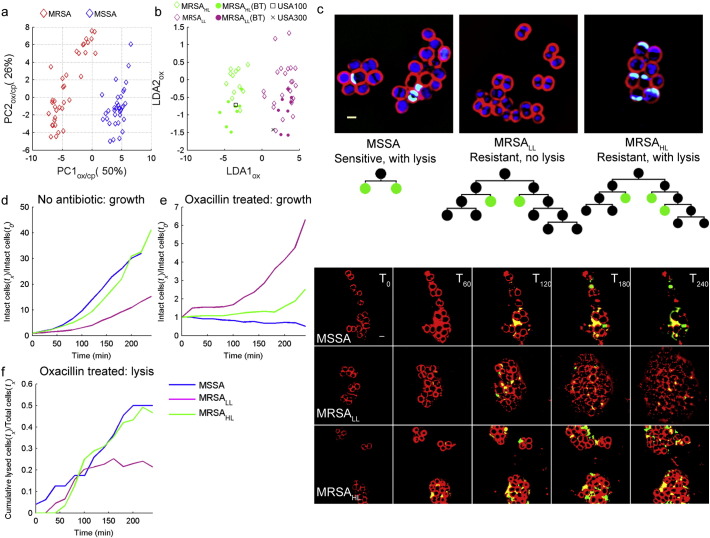
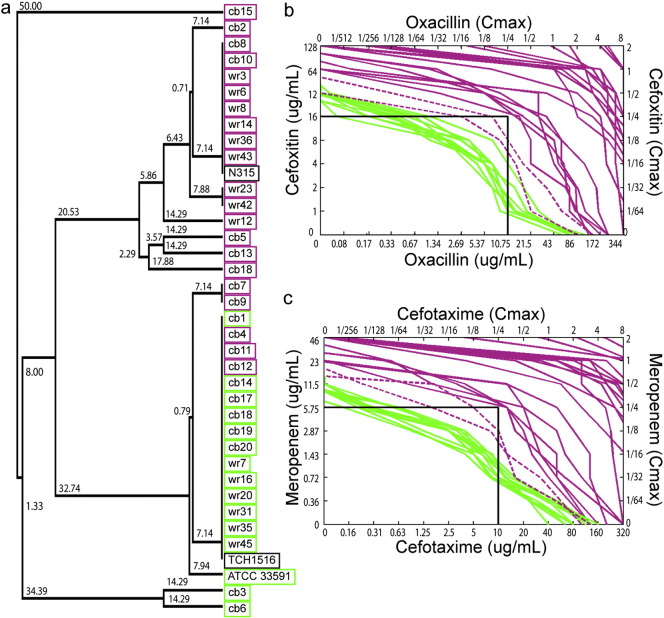
Successful treatment of bacterial infections requires the timely administration of appropriate antimicrobial therapy. The failure to initiate the correct therapy in a timely fashion results in poor clinical outcomes, longer hospital stays, and higher medical costs. Current approaches to antibiotic susceptibility testing of cultured pathogens have key limitations ranging from long run times to dependence on prior knowledge of genetic mechanisms of resistance. We have developed a rapid antimicrobial susceptibility assay for Staphylococcus aureus based on bacterial cytological profiling (BCP), which uses quantitative fluorescence microscopy to measure antibiotic induced changes in cellular architecture. BCP discriminated between methicillin-susceptible (MSSA) and -resistant (MRSA) clinical isolates of S. aureus (n = 71) within 1-2 h with 100% accuracy. Similarly, BCP correctly distinguished daptomycin susceptible (DS) from daptomycin non-susceptible (DNS) S. aureus strains (n = 20) within 30 min. Among MRSA isolates, BCP further identified two classes of strains that differ in their susceptibility to specific combinations of beta-lactam antibiotics. BCP provides a rapid and flexible alternative to gene-based susceptibility testing methods for S. aureus, and should be readily adaptable to different antibiotics and bacterial species as new mechanisms of resistance or multidrug-resistant pathogens evolve and appear in mainstream clinical practice.
Keywords: Antibiotic resistance; Multidrug resistant bacteria; Staphylococcus aureus; Susceptibility tests.
Figures
Similar articles
-
Phenotypic and genotypic characterization of methicillin-resistant Staphylococcus aureus (MRSA) and methicillin-susceptible Staphylococcus aureus (MSSA) from different sources in China.Foodborne Pathog Dis. 2013 Mar;10(3):214-21. doi: 10.1089/fpd.2012.1205. Epub 2013 Feb 13. Foodborne Pathog Dis. 2013. PMID: 23405883
-
Antimicrobial susceptibility profiles of meticillin-susceptible and -resistant Staphylococcus aureus: focus on daptomycin minimum inhibitory concentrations at a tertiary care centre in Mumbai, India.Int J Antimicrob Agents. 2010 Sep;36(3):267-70. doi: 10.1016/j.ijantimicag.2010.05.013. Epub 2010 Jul 1. Int J Antimicrob Agents. 2010. PMID: 20594809
-
Impact of an assay that enables rapid determination of Staphylococcus species and their drug susceptibility on the treatment of patients with positive blood culture results.Infect Control Hosp Epidemiol. 2010 Oct;31(10):1043-8. doi: 10.1086/656248. Infect Control Hosp Epidemiol. 2010. PMID: 20731594
-
Antibiotic Resistance in the Treatment of Staphylococcus aureus Keratitis: a 20-Year Review.Cornea. 2015 Jun;34(6):698-703. doi: 10.1097/ICO.0000000000000431. Cornea. 2015. PMID: 25811722 Free PMC article. Review.
-
Clinical, epidemiologic, and laboratory aspects of methicillin-resistant Staphylococcus aureus infections.Methods Mol Biol. 2014;1085:1-24. doi: 10.1007/978-1-62703-664-1_1. Methods Mol Biol. 2014. PMID: 24085687 Review.
Cited by
-
Technologies for High-Throughput Identification of Antibiotic Mechanism of Action.Antibiotics (Basel). 2021 May 12;10(5):565. doi: 10.3390/antibiotics10050565. Antibiotics (Basel). 2021. PMID: 34065815 Free PMC article. Review.
-
Profiling the effect of nafcillin on HA-MRSA D712 using bacteriological and physiological media.Sci Data. 2019 Dec 17;6(1):322. doi: 10.1038/s41597-019-0331-z. Sci Data. 2019. PMID: 31848353 Free PMC article.
-
Identification and Antibiotic-Susceptibility Profiling of Infectious Bacterial Agents: A Review of Current and Future Trends.Biotechnol J. 2019 Jan;14(1):e1700750. doi: 10.1002/biot.201700750. Epub 2018 Aug 26. Biotechnol J. 2019. PMID: 30024110 Free PMC article. Review.
-
Scope and Predictive Genetic/Phenotypic Signatures of Bicarbonate (NaHCO3) Responsiveness and β-Lactam Sensitization in Methicillin-Resistant Staphylococcus aureus.Antimicrob Agents Chemother. 2020 Apr 21;64(5):e02445-19. doi: 10.1128/AAC.02445-19. Print 2020 Apr 21. Antimicrob Agents Chemother. 2020. PMID: 32041719 Free PMC article.
-
Bacterial Cytological Profiling as a Tool To Study Mechanisms of Action of Antibiotics That Are Active against Acinetobacter baumannii.Antimicrob Agents Chemother. 2019 Mar 27;63(4):e02310-18. doi: 10.1128/AAC.02310-18. Print 2019 Apr. Antimicrob Agents Chemother. 2019. PMID: 30745382 Free PMC article.
References
-
- ADD-Vantage® . Sandoz Inc.; NJ: 2015. Oxacillin Sodium ADD-Vantage® Princeton.
-
- Aiba Y., Katayama Y., Hishinuma T., Murakami-Kuroda H., Cui L., Hiramatsu K. Mutation of RNA polymerase β-subunit gene promotes heterogeneous-to-homogeneous conversion of β-lactam resistance in methicillin-resistant Staphylococcus aureus. Antimicrob. Agents Chemother. 2013;57:4861–4871. - PMC - PubMed
-
- Andersson D.I., Levin B.R. The biological cost of antibiotic resistance. Curr. Opin. Microbiol. 1999;2:489–493. - PubMed
-
- Bauer K.A., West J.E., Balada-Llasat J.M., Pancholi P., Stevenson K.B., Goff D.A. An antimicrobial stewardship program's impact with rapid polymerase chain reaction methicillin-resistant Staphylococcus aureus/S. aureus blood culture test in patients with S. aureus bacteremia. Clin. Infect. Dis. 2010;51:1074–1080. - PubMed
-
- Bayer A.S., Mishra N.N., Chen L., Kreiswirth B.N., Rubio A., Yang S.J. Frequency and distribution of single-nucleotide polymorphisms within mprF in methicillin-resistant Staphylococcus aureus clinical isolates and their role in cross-resistance to daptomycin and host defense antimicrobial peptides. Antimicrob. Agents Chemother. 2015;59:4930–4937. - PMC - PubMed
Publication types
MeSH terms
Substances
Grants and funding
LinkOut - more resources
Full Text Sources
Other Literature Sources
Medical
Molecular Biology Databases
