. 2016 Mar 24;531(7595):508-12.
doi: 10.1038/nature17172. Epub 2016 Mar 16.

Memory retrieval by activating engram cells in mouse models of early Alzheimer's disease

Affiliations

Memory retrieval by activating engram cells in mouse models of early Alzheimer's disease

Dheeraj S Roy et al. Nature. .

Abstract

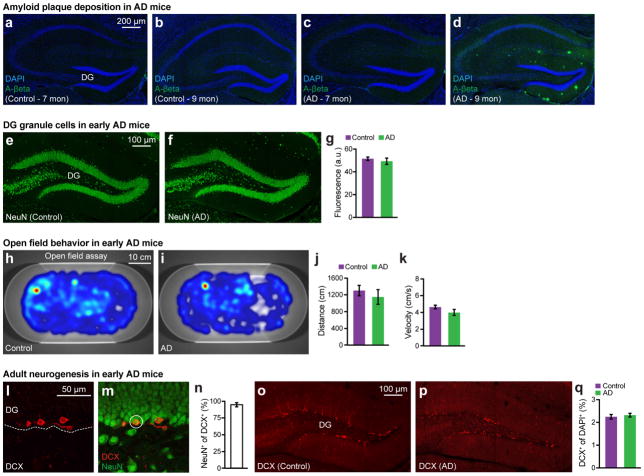
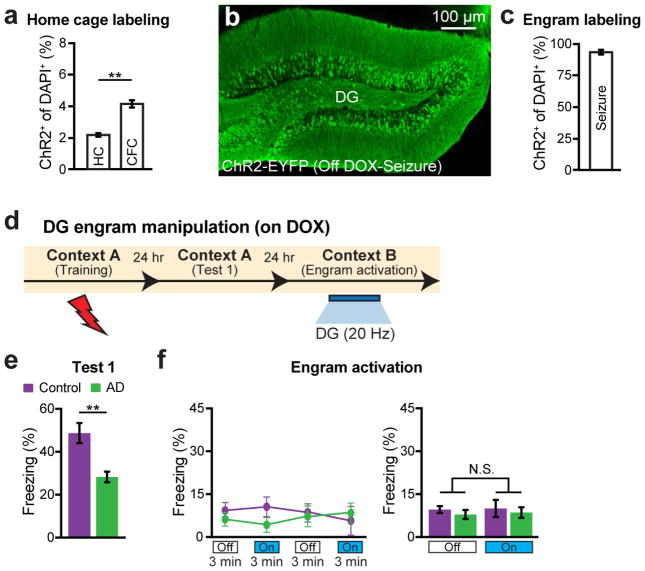
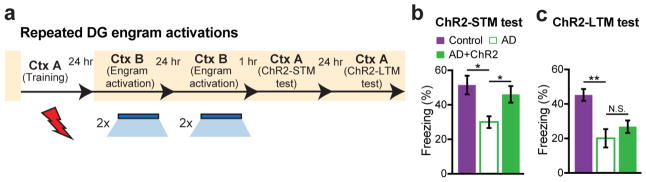
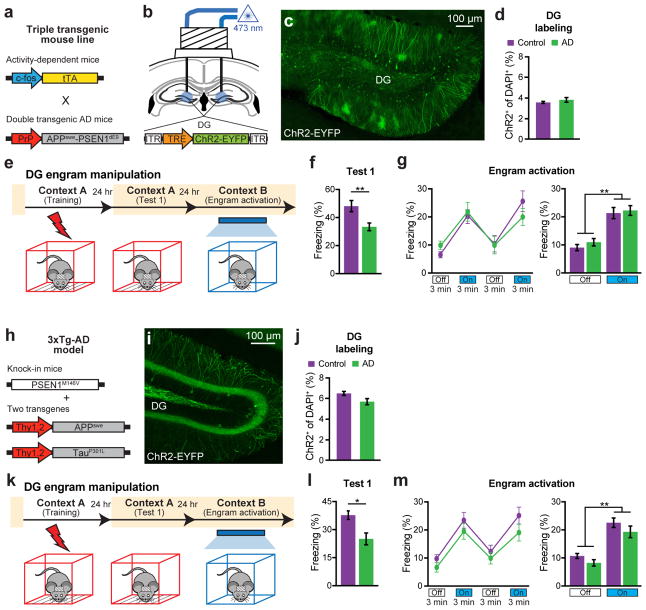
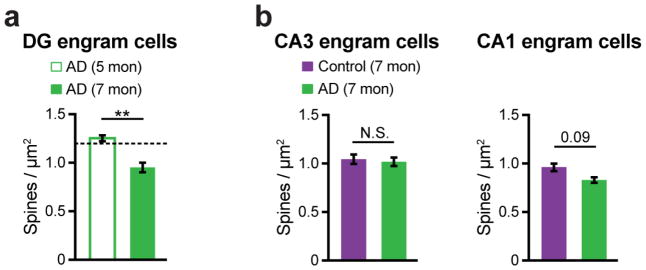
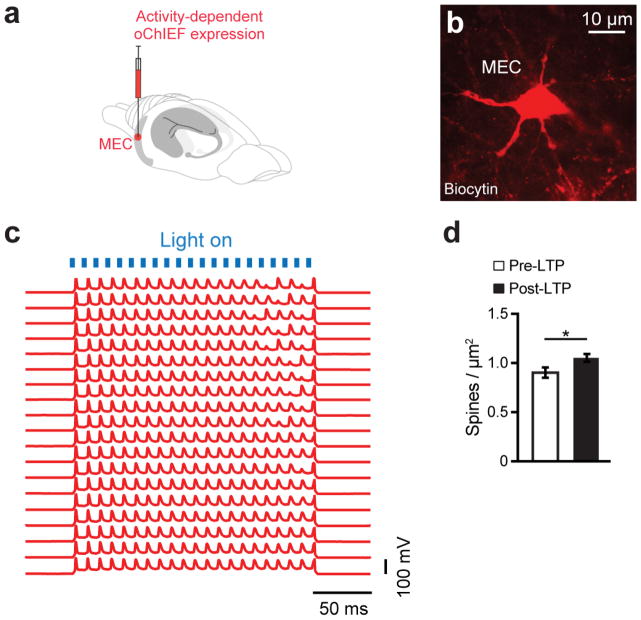
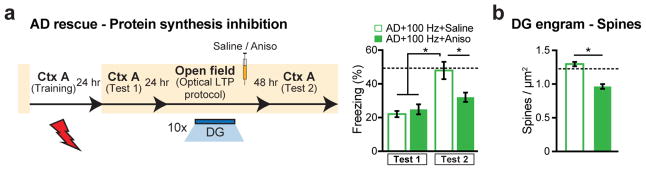
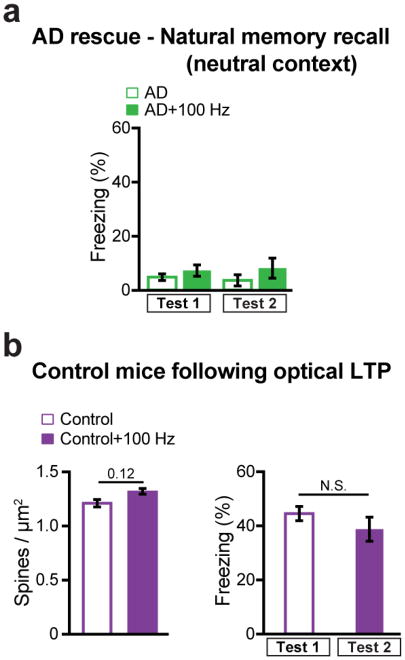
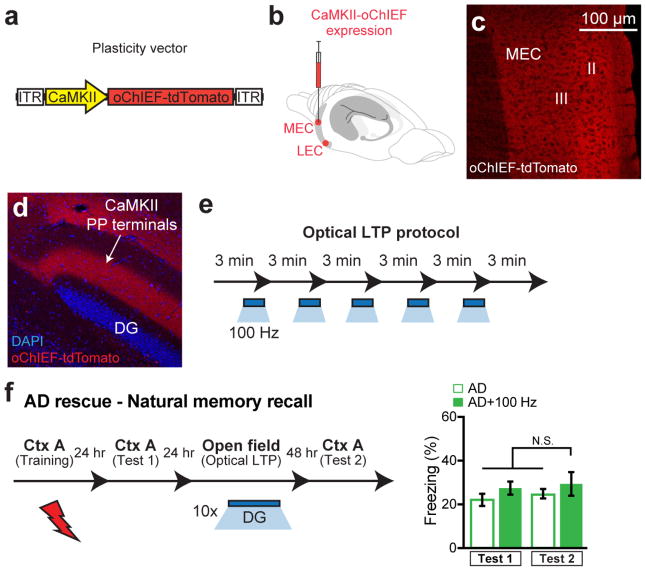
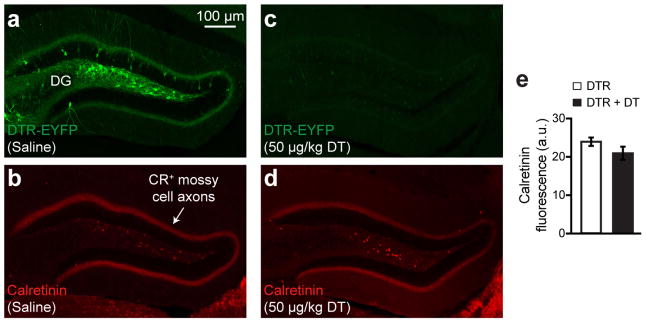
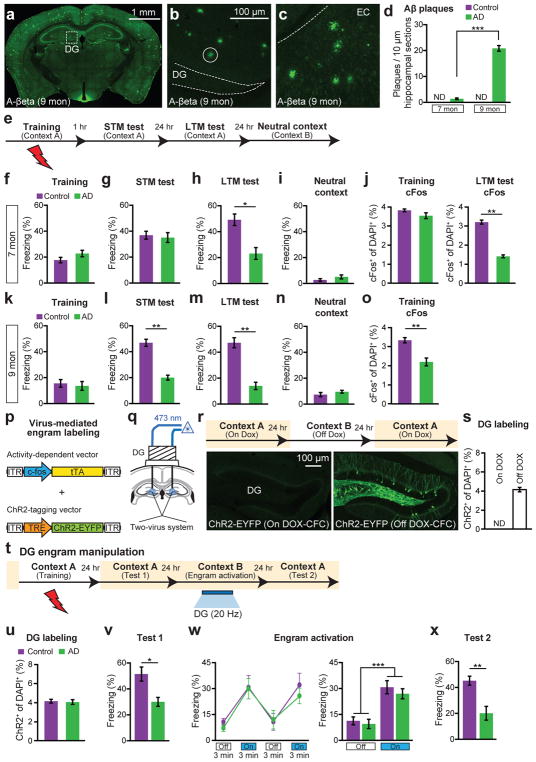
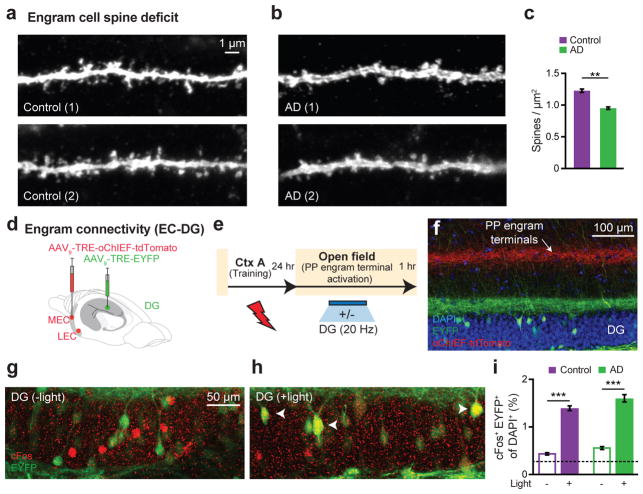
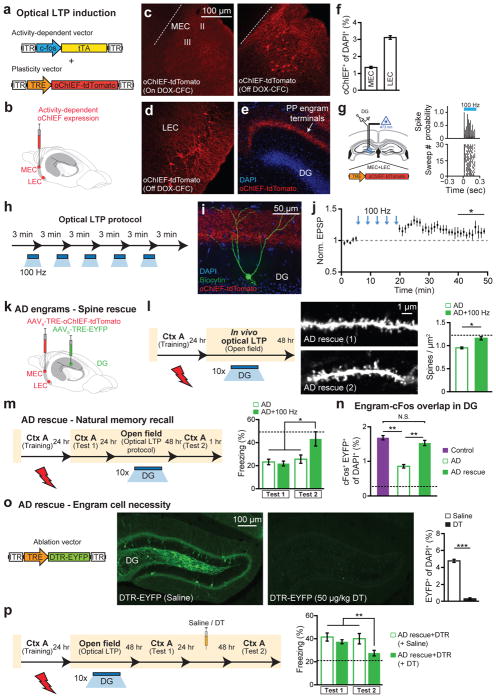
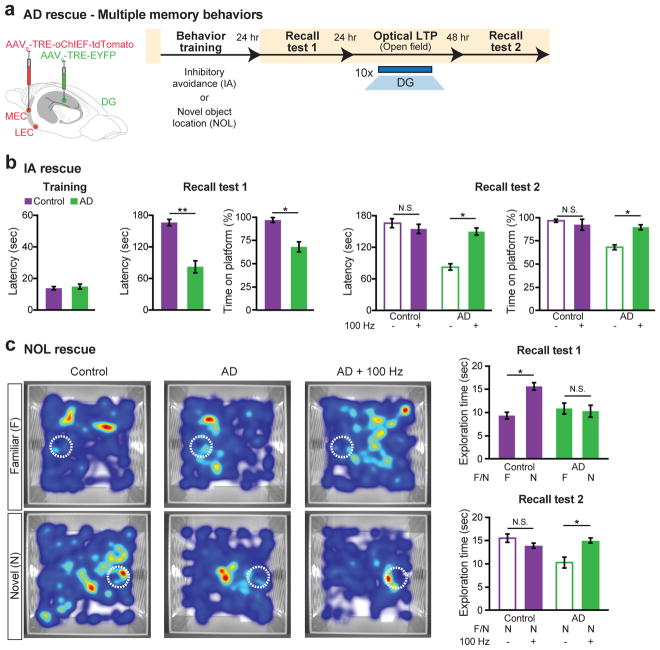
Alzheimer's disease (AD) is a neurodegenerative disorder characterized by progressive memory decline and subsequent loss of broader cognitive functions. Memory decline in the early stages of AD is mostly limited to episodic memory, for which the hippocampus has a crucial role. However, it has been uncertain whether the observed amnesia in the early stages of AD is due to disrupted encoding and consolidation of episodic information, or an impairment in the retrieval of stored memory information. Here we show that in transgenic mouse models of early AD, direct optogenetic activation of hippocampal memory engram cells results in memory retrieval despite the fact that these mice are amnesic in long-term memory tests when natural recall cues are used, revealing a retrieval, rather than a storage impairment. Before amyloid plaque deposition, the amnesia in these mice is age-dependent, which correlates with a progressive reduction in spine density of hippocampal dentate gyrus engram cells. We show that optogenetic induction of long-term potentiation at perforant path synapses of dentate gyrus engram cells restores both spine density and long-term memory. We also demonstrate that an ablation of dentate gyrus engram cells containing restored spine density prevents the rescue of long-term memory. Thus, selective rescue of spine density in engram cells may lead to an effective strategy for treating memory loss in the early stages of AD.


Conflict of interest statement

The authors declare no competing financial interests.

Figures

Extended Data Figure 1
Extended Data Figure 1. Characterization of 7-month old early AD mice
a–d, Images showing hippocampal Aβ+ plaques lacking in control mice (a, b) and 7-month old AD mice (c), which showed an age-dependent increase in 9-month old AD mice (d). e–f, Images showing neuronal nuclei (NeuN) staining of DG granule cells in control (e) and 7-month old AD (f) mice. g, NeuN+ fluorescence intensity of the granule cell layer from control and AD sections shown in e–f (n = 8 mice per group). h–i, Heat maps showing exploratory behavior in an open field arena from control (h) and 7-month old AD (i) mice. j–k, Distance traveled (j) and velocity (k) did not differ between control and AD groups (n = 9 mice per group). l–m, Images showing adult newborn neurons (DCX+) in DG sections from control mice (l) that are double positive for NeuN (m). n, Percentage of NeuN+ cells among DCX+ cells (n = 3 mice). o–p, Images showing DCX+ neurons in DG sections from control (o) and AD (p) groups (n = 4 mice per group). q, DCX+ cell counts from control and AD mice. Data are presented as mean ± SEM.
Extended Data Figure 2
Extended Data Figure 2. Labeling and engram activation of early AD mice on DOX
a, Mice are taken off DOX for 24 hours in the home cage (HC) and subsequently trained in CFC. DG sections (n = 3 mice per group) revealed 2.05% ChR2-EYFP labeling in the HC, consistent with the previously established engram tagging strategy. b, Mice were injected with a virus cocktail of AAV9-c-fos-tTA and AAV9-TRE-ChR2-EYFP. After one day off DOX, kainic acid was used to induce seizures. Image showing efficient labeling throughout the DG. c, ChR2-EYFP cell counts from DG sections shown in b (n = 3 mice). d, Behavioral schedule for optogenetic activation of DG engram cells. e, Memory recall 1 day after training (Test 1) showed less freezing of AD mice compared to control mice (n = 8 mice per group). f, Engram activation with blue light stimulation (left). Average freezing for the two light-off and light-on epochs (right). Statistical comparisons are performed using unpaired t tests; **P < 0.01. Data are presented as mean ± SEM.
Extended Data Figure 3
Extended Data Figure 3. Chronic DG engram activation in early AD mice did not rescue long-term memory
a, Behavioral schedule for repeated DG engram activation experiment. b, AD mice in which a DG memory engram was reactivated twice a day for two days (AD+ChR2) showed increased STM freezing levels compared to memory recall prior to engram reactivation (ChR2-STM test, n = 9 mice per group). c, Memory recall 1 day after repeated DG engram activations (ChR2-LTM test). N.S., not significant. Statistical comparisons are performed using unpaired t tests; *P < 0.05, **P < 0.01. Data are presented as mean ± SEM.
Extended Data Figure 4
Extended Data Figure 4. Engram activation restores fear memory in triple transgenic and PS1/APP/tau models of early AD
a, Triple transgenic mouse line obtained by mating c-fos-tTA transgenic mice, with double transgenic APP/PS1 AD mice. These mice combined with a DOX-sensitive AAV virus permits memory engram labeling in early AD. b, Triple transgenic mice were injected with AAV9-TRE-ChR2-EYFP and implanted with an optic fiber targeting the DG. c, Image showing DG engram cells of triple transgenic mice 24 hours after CFC. d, ChR2-EYFP cell counts from control and triple transgenic AD mice (n = 5 mice per group). e, Behavioral schedule for engram activation. f, Memory recall 1 day after training (Test 1) showed less freezing of triple transgenic AD mice compared to control mice (n = 10 mice per group). g, Engram activation with blue light stimulation (left). Average freezing for the two light-off and light-on epochs (right). h, Triple transgenic AD model (3xTg-AD) as previously reported. A cocktail of AAV9-c-fos-tTA and AAV9-TRE-ChR2-EYFP viruses were used to label memory engrams in 3xTg-AD mice. i, Image showing memory engram cells in the DG of 3xTg-AD mice 24 hours after CFC. j, ChR2-EYFP cell counts from DG sections of control and 3xTg-AD mice (n = 4 mice per group). k, Behavioral schedule for engram activation. l, Memory recall 1 day after training (Test 1) showed less freezing of 3xTg-AD mice compared to control mice (n = 9 mice per group). m, Engram activation with blue light stimulation (left). Average freezing for the two light-off and light-on epochs (right). Statistical comparisons are performed using unpaired t tests; *P < 0.05, **P < 0.01. Data are presented as mean ± SEM.
Extended Data Figure 5
Extended Data Figure 5. Dendritic spines of engram cells in 7-month old early AD mice
a, Average dendritic spine density of DG engram cells showed an age-dependent decrease in 7-month old APP/PS1 AD mice (n = 7032 spines) as compared to 5-month old AD mice (n = 4577 spines, n = 4 mice per group). Dashed line represents spine density of control mice (1.21). b, (Left) Average dendritic spine density of CA3 engram cells in control (n = 5123 spines) and AD mice (n = 6019 spines, n = 3 mice per group). (Right) Average dendritic spine density of CA1 engram cells in control (n = 9120 spines) and AD mice (n = 7988 spines, n = 5 mice per group). N.S., not significant. Statistical comparisons are performed using unpaired t tests; **P < 0.01. Data are presented as mean ± SEM.
Extended Data Figure 6
Extended Data Figure 6. High fidelity responses of oChIEF+ cells and dendritic spines of DG engram cells after in vitro optical LTP
a, Entorhinal cortex (EC) cells were injected with a virus cocktail containing AAV9-TRE-oChIEF-tdTomato for activity-dependent labeling. b, Image showing a biocytin-filled oChIEF+ stellate cell in EC. c, 100 Hz (2 ms pulse width) stimulation of an oChIEF+ cell across 20 consecutive trials. Spiking responses exhibit high fidelity. d, Average dendritic spine density of biocytin-filled DG cells showed an increase following optical LTP induction in vitro (n = 1452 spines, n = 6 cells). Statistical comparisons are performed using unpaired t tests; *P < 0.05. Data are presented as mean ± SEM.
Extended Data Figure 7
Extended Data Figure 7. Behavioral rescue and spine restoration by optical LTP is protein-synthesis dependent
a, Modified behavioral schedule for long-term rescue of memory recall in AD mice in the presence of saline or anisomycin (left). Memory recall 2 days after LTP induction followed by drug administration showed less freezing of AD mice treated with anisomycin (AD + 100 Hz + Aniso) compared to saline treated AD mice (AD + 100 Hz + Saline, n = 9 mice per group; right). Dashed line represents freezing level of control mice (48.53). b, Average dendritic spine density in early AD mice treated with anisomycin after LTP induction (n = 4810 spines) was decreased compared to saline treated AD mice (n = 6242 spines, n = 4 mice per group). Dashed line represents spine density of control mice (1.21). Statistical comparisons are performed using unpaired t tests; *P < 0.05. Data are presented as mean ± SEM.
Extended Data Figure 8
Extended Data Figure 8. Rescued early AD mice behavior in a neutral context and control mice following in vivo optical LTP
a, After the long-term rescue of memory recall in AD mice (Test 2, Fig. 3m), animals were placed in an untrained neutral context to measure generalization (n = 10 mice per group). Rescued AD mice (AD+100 Hz) did not display freezing behavior. b, (Left) Average dendritic spine density of DG engram cells from control mice remained unchanged following optical LTP induction in vivo (Control + 100 Hz, n = 4211 spines, n = 3 mice; Control data from Figure 2c). (Right) The behavioral rescue protocol applied to early AD mice (Fig. 3m) was tested in age-matched control mice (n = 9 mice per group). Similar freezing levels were observed following optical LTP (Test 2) as compared to memory recall prior to the 100 Hz protocol (Test 1). N.S., not significant. Statistical comparisons are performed using unpaired t tests. Data are presented as mean ± SEM.
Extended Data Figure 9
Extended Data Figure 9. Optical LTP using a CaMKII-oChIEF virus did not rescue memory in early AD mice
a, AAV virus expressing oChIEF-tdTomato under a CaMKII promoter. b, CaMKII-oChIEF virus injected into MEC and LEC. c–d, Images showing tdTomato labeling in a large portion of excitatory MEC neurons (c) as well as the PP terminals in DG (d). e, In vivo optical LTP protocol. f, Behavioral schedule for long-term rescue of memory recall in AD mice (left). In contrast to the engram-specific strategy, long-term memory could not be rescued by stimulating a large portion of excitatory PP terminals in the DG (right; n = 9 mice per group). N.S. not significant. Statistical comparisons are performed using unpaired t tests. Data are presented as mean ± SEM.
Extended Data Figure 10
Extended Data Figure 10. Normal DG mossy cell density after engram cell ablation
a–d, Images showing DG engram cells after saline treatment (a) and the corresponding calretinin positive (CR+) mossy cell axons (b). DTR-EYFP engram cell labeling after DT treatment (c) and the respective CR+ mossy cell axons (d). e, CR+ fluorescence intensity of mossy cell axons from saline and DT treated DG sections shown in ad (n = 8 mice per group). Data are presented as mean ± SEM.
Figure 1
Figure 1. Optogenetic activation of memory engrams restores fear memory in early AD mice
a–c, Aβ plaques in 9-month old AD mice (a), in DG (b), and in EC (c). d, Plaque counts in hippocampal sections (n = 4 mice per group). e, CFC behavioral schedule (n = 10 mice per group). f–i, Freezing levels of 7-month old AD groups during training (f), STM test (g), LTM test (h) or exposure to neutral context (i). j, cFos+ cell counts in the DG of 7-month old mice following CFC training or LTM test, represented in f, h (n = 4 mice per group). k–n, Freezing levels of 9-month old AD mice during training (k), STM test (l), LTM test (m) or exposure to neutral context (n). o, cFos+ cell counts in the DG of 9-month old mice (n = 3 mice per group) following CFC training represented in k. p, Virus-mediated engram labeling strategy using a cocktail of AAV9-c-fos-tTA and AAV9-TRE-ChR2-EYFP. q, AD mice were injected with the two-viruses bilaterally and implanted with an optic fiber bilaterally into the DG. r, Behavioral schedule and DG-engram cell labeling (see Methods). s, ChR2-EYFP+ cell counts from DG sections shown in r (n = 3 mice per group). ND, not detected. t, Behavioral schedule for optogenetic activation of DG engram cells. u, ChR2-EYFP+ cell counts from 7-month old mice (n = 5 mice per group). v, Memory recall in Context A 1 day after training (Test 1, n = 9 mice per group). w, Freezing by blue light stimulation (left). Average freezing for two light-off and light-on epochs (right). x, Memory recall in Context A 3 days after training (Test 2). Statistical comparisons are performed using unpaired t tests; *P < 0.05, **P < 0.01, ***P < 0.001. Data are presented as mean ± SEM.
Figure 2
Figure 2. Neural correlates of amnesia in early AD mice
a–b, Images showing dendritic spines from DG engram cells of control (a) and AD (b) groups. c, Average spine density showing a decrease in AD mice (n = 7032 spines) compared to controls (n = 9437 spines, n = 4 mice per group). d, For engram connectivity, MEC/LEC and DG cells were injected with virus cocktails. e, Engram connectivity behavioral schedule. Mice (n = 4 per group) were either given a natural exploration session (Light −) or a PP engram terminal stimulation session (Light +) in an open field. f, Image showing simultaneous labeling of engram terminals (red) and engram cells (green). Green terminals reflect mossy cell axons. g–h, Images showing cFos+/EYFP+ overlap in the DG. i, cFos+/EYFP+ counts from control and AD mice. Chance overlap (0.24) calculated (see Methods) and indicated by the dashed line. Statistical comparisons are performed using unpaired t tests; **P < 0.01, ***P < 0.001. Data are presented as mean ± SEM.
Figure 3
Figure 3. Reversal of engram-specific spine deficits rescues memory in early AD mice
a, Engram-specific optical LTP using two viruses. b, Virus cocktail injected into MEC/LEC. c–e, Images showing oChIEF labeling 24 hours after CFC: in MEC on DOX (left) and off DOX (right; c); in LEC off DOX (d); in DG off DOX (sagittal; e). Scale bar shown in c, applies to d and e. f, oChIEF+ cell counts (n = 3 mice per group). g, In vivo spiking of DG neurons in response to 100 Hz light applied to PP terminals. h, Optical LTP protocol. i–j, In vitro responses of DG cells after optical LTP. Image showing biocytin-filled DG cell receiving oChIEF+ PP terminals (coronal; i). Excitatory post-synaptic potentials (EPSPs) showing a 10% increase in amplitude (n = 6 cells; j). k, For in vivo optical LTP at EC-DG synapses, MEC/LEC and DG cells were injected with virus cocktails. l, Protocol for in vivo spine restoration of DG engram cells in AD mice (left). Images showing dendritic spines of DG engram cells following LTP (middle). A two-way ANOVA followed by Bonferroni post-hoc tests revealed a spine density restoration in AD+100 Hz mice (F1,211 = 7.21, P < 0.01, 13025 spines, n = 4 mice per group; right). Dashed line represents control mice spine density (1.21). m, Behavioral schedule for memory rescue in AD mice (left). A two-way ANOVA with repeated measures followed by Bonferroni post-hoc tests revealed restored freezing in AD+100 Hz mice (F1,36 = 4.95, P < 0.05, n = 10 mice per group; right). Dashed line represents control mice freezing (48.53). n, Following rescue, mice were perfused for cFos+/EYFP+ overlap cell counts. Chance estimated at 0.22. N.S., not significant. o, Construct for ablation of engram cells using DTR (left). Images showing DG engram cells after saline/DT administration (middle). DTR-EYFP cell counts (n = 5 mice per group; right). p, Behavioral schedule testing the necessity of engram cells following spine restoration (left). Memory recall showed less freezing of AD mice treated with DT (AD rescue + DTR + DT) compared to saline treated mice (n = 9 mice per group; right). Dashed line represents freezing of non-stimulated early AD mice (20.48). Unless specified, statistical comparisons are performed using unpaired t tests; *P < 0.05, **P < 0.01, ***P < 0.001. Data are presented as mean ± SEM.
Figure 4
Figure 4. Recovery of multiple types of hippocampal-dependent memories from amnesia in early AD
a, MEC/LEC and DG cells were injected with virus cocktails (left). Behavioral schedule for engram labeling (right). b, IA long-term rescue (n = 10 mice per group). Recall test 1 showed decreased latency and time on platform for AD mice. A two-way ANOVA with repeated measures followed by Bonferroni post-hoc tests revealed a recovery of IA memory in early AD mice (Latency: F1,27 = 25.22, P < 0.001; Time on platform: F1,27 = 6.46, P < 0.05; Recall test 2). c, NOL long-term rescue (n = 15 mice per group). Average heat maps showing exploration time for familiar or novel locations (left or right, respectively). White circles represent object location. Recall test 1 showed comparable exploration of familiar locations by control and AD mice, however AD mice showed decreased exploration of novel locations. A two-way ANOVA with repeated measures followed by Bonferroni post-hoc tests revealed a recovery of NOL memory in early AD mice (F1,56 = 5.87, P < 0.05; Recall test 2). Unless specified, statistical comparisons are performed using unpaired t tests; *P < 0.05, **P < 0.01. Data are presented as mean ± SEM.

Comment in

  • Alzheimer's disease: Lost memories found.
    Shrestha P, Klann E. Shrestha P, et al. Nature. 2016 Mar 24;531(7595):450-1. doi: 10.1038/nature17312. Epub 2016 Mar 16. Nature. 2016. PMID: 26982731 No abstract available.
  • Lost and found.
    Munoz-Lopez M, Morris RGM. Munoz-Lopez M, et al. Neuroscience. 2016 Jun 21;326:v-vii. doi: 10.1016/j.neuroscience.2016.04.012. Epub 2016 Apr 13. Neuroscience. 2016. PMID: 27085990 No abstract available.

References

    1. Selkoe DJ. Alzheimer’s disease: genes, proteins, and therapy. Physiol Rev. 2001;81:741–766. - PubMed
    1. Selkoe DJ. Alzheimer’s disease is a synaptic failure. Science. 2002;298:789–791. - PubMed
    1. Jacobsen JS, et al. Early-onset behavioral and synaptic deficits in a mouse model of Alzheimer’s disease. Proc Natl Acad Sci USA. 2006;103:5161–5166. - PMC - PubMed
    1. Hsia AY, et al. Plaque-independent disruption of neural circuits in Alzheimer’s disease mouse models. Proc Natl Acad Sci USA. 1999;96:3228–3233. - PMC - PubMed
    1. Mucke L, et al. High-level neuronal expression of Aβ1-42 in wild-type human amyloid protein precursor transgenic mice: synaptotoxicity without plaque formation. J Neurosci. 2000;20:4050–4058. - PMC - PubMed

Publication types

MeSH terms