

The Effect of Disease-Modifying Drugs on Brain Atrophy in Relapsing-Remitting Multiple Sclerosis: A Meta-Analysis
- PMID: 26983008
- PMCID: PMC4794160
- DOI: 10.1371/journal.pone.0149685
The Effect of Disease-Modifying Drugs on Brain Atrophy in Relapsing-Remitting Multiple Sclerosis: A Meta-Analysis
Abstract
Background: The quantification of brain atrophy in relapsing-remitting multiple sclerosis (RRMS) may serve as a marker of disease progression and treatment response. We compared the association between first-line (FL) or second-line (SL) disease-modifying drugs (DMDs) and brain volume changes over time in RRMS.
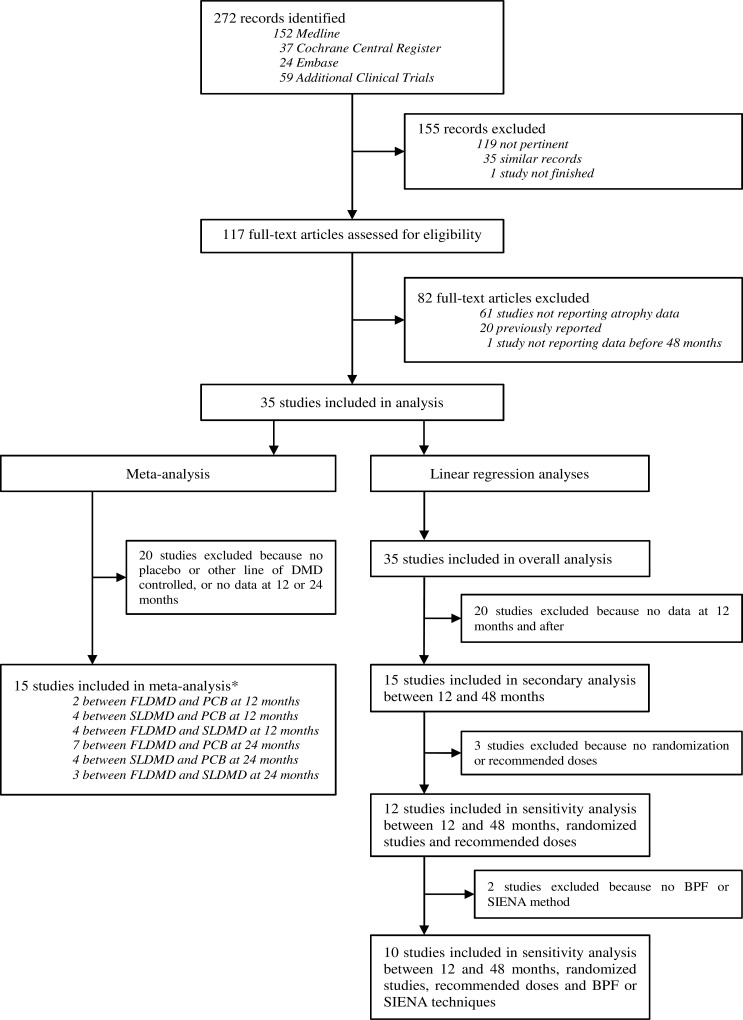
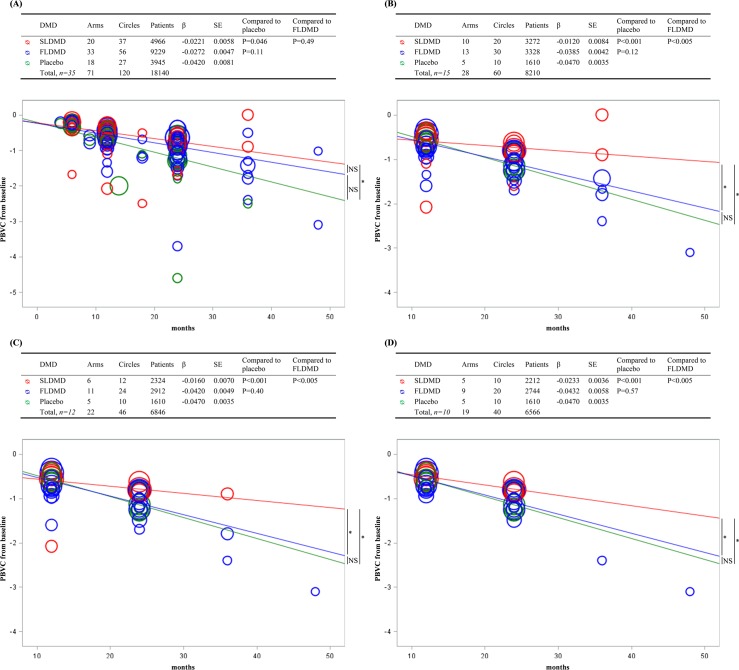
Materials and methods: We reviewed clinical trials in RRMS between January 1, 1995 and June 1, 2014 that assessed the effect of DMDs and reported data on brain atrophy in Medline, Embase, the Cochrane database and meeting abstracts. First, we designed a meta-analysis to directly compare the percentage brain volume change (PBVC) between FLDMDs and SLDMDs at 24 months. Second, we conducted an observational and longitudinal linear regression analysis of a 48-month follow-up period. Sensitivity analyses considering PBVC between 12 and 48 months were also performed.
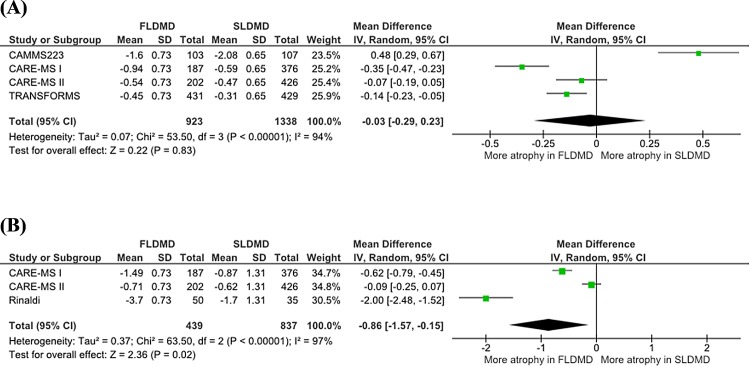
Results: Among the 272 studies identified, 117 were analyzed and 35 (18,140 patients) were included in the analysis. Based on the meta-analysis, atrophy was greater for the use of an FLDMD than that of an SLDMD at 24 months (primary endpoint mean difference, -0.86; 95% confidence interval: -1.57--0.15; P = 0.02). Based on the linear regression analysis, the annual PBVC significantly differed between SLDMDs and placebo (-0.27%/y and -0.50%/y, respectively, P = 0.046) but not between FLDMDs (-0.33%/y) and placebo (P = 0.11) or between FLDMDs and SLDMDs (P = 0.49). Based on sensitivity analysis, the annual PBVC was reduced for SLDMDs compared with placebo (-0.14%/y and -0.56%/y, respectively, P<0.001) and FLDMDs (-0.46%/y, P<0.005), but no difference was detected between FLDMDs and placebo (P = 0.12).
Conclusions: SLDMDs were associated with reduced PBVC slope over time in RRMS, regardless of the period considered. These results provide new insights into the mechanisms underlying atrophy progression in RRMS.
Conflict of interest statement
Figures
References
-
- Barkhof F. The clinico-radiological paradox in multiple sclerosis revisited. Curr Opin Neurol. 2002;15: 239–245. - PubMed
Publication types
MeSH terms
LinkOut - more resources
Full Text Sources
Other Literature Sources
