. 2016 Mar 17:6:23246.
doi: 10.1038/srep23246.

Three chromosomal rearrangements promote genomic divergence between migratory and stationary ecotypes of Atlantic cod

Affiliations

Three chromosomal rearrangements promote genomic divergence between migratory and stationary ecotypes of Atlantic cod

Paul R Berg et al. Sci Rep. .

Abstract

Identification of genome-wide patterns of divergence provides insight on how genomes are influenced by selection and can reveal the potential for local adaptation in spatially structured populations. In Atlantic cod - historically a major marine resource - Northeast-Arctic- and Norwegian coastal cod are recognized by fundamental differences in migratory and non-migratory behavior, respectively. However, the genomic architecture underlying such behavioral ecotypes is unclear. Here, we have analyzed more than 8.000 polymorphic SNPs distributed throughout all 23 linkage groups and show that loci putatively under selection are localized within three distinct genomic regions, each of several megabases long, covering approximately 4% of the Atlantic cod genome. These regions likely represent genomic inversions. The frequency of these distinct regions differ markedly between the ecotypes, spawning in the vicinity of each other, which contrasts with the low level of divergence in the rest of the genome. The observed patterns strongly suggest that these chromosomal rearrangements are instrumental in local adaptation and separation of Atlantic cod populations, leaving footprints of large genomic regions under selection. Our findings demonstrate the power of using genomic information in further understanding the population dynamics and defining management units in one of the world's most economically important marine resources.


Figures

Figure 1
Figure 1. Map of sampling locations for the three Atlantic cod populations used in this study.
Red dots indicate the position where the samples were collected. The intersect (a) show a detailed view of the Lofoten area. NEAC = Northeast Arctic cod, NCC = Norwegian coastal cod, NS = North Sea cod. See Table 1 for a detailed description of the samples. The map was modified from http://www.graphic-flash-sources.com/europe-free-vector-map/ using Adobe Illustrator CS5.
Figure 2
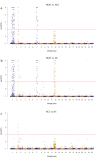
Figure 2. Locus specific FST values for the pairwise population comparisons between Northeast-Arctic, Norwegian coastal and North Sea cod.
(a) The observed FST pattern indicates three distinct regions of the genome with elevated FST values in the NEAC-NCC comparison. (b) In the comparison between NEAC and the geographically more distant NS population, four distinct regions with elevated FST values are observed. (c) Only smaller areas of the genome shows elevated FST values in the NCC-NS comparison even though they are collected from geographically distant locations. SNPs are ordered according to linkage group and position within linkage groups. SNPs that are identified as putatively under selection are in red color. NEAC = Northeast Arctic cod, NCC = Norwegian coastal cod, NS = North Sea cod.
Figure 3
Figure 3. Heterozygosity level across all linkage groups in the Northeast-Arctic, Norwegian coastal and North Sea cod.
SNPs are ordered according to linkage group and position within linkage groups. The observed heterozygosity pattern shows four distinct regions of the genome with distinctly different heterozygosity values. NEAC = Northeast Arctic cod, NCC = Norwegian coastal cod, NS = North Sea cod.
Figure 4
Figure 4. Manhattan plot of pairwise outlier analyses based on median log10 (PO) from 10 replicate runs of BAYESCAN.
(a) The observed outlier pattern between NEAC and NCC indicate that the outliers are clustered within three distinct genomic areas. Only one additional outlier is detected in LG4. (b) In the comparison between NEAC and the geographically more distant NS population, an additional outlier area is observed in LG12. (c) In the NCC-NS comparison, the outlier area in LG2 is observed, but with lower log10 (PO) values. SNPs are plotted according to linkage group and position within the linkage groups along the X-axis. The red line at 1 indicates ‘strong association’ according to Jeffreys. NEAC = Northeast Arctic cod, NCC = Norwegian coastal cod, NS = North Sea cod. For visualization purpose, maximum log10(PO) values are set to 4 and all underlying values are found in Supplementary Table S1.
Figure 5
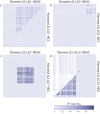
Figure 5. Linkage disequilibrium in linkage group 1, 2, 7 and 12.
Pair-wise LD among loci, measured as r2, are estimated within the Northeast-Arctic cod (above the diagonal) and Norwegian coastal cod (below the diagonal) populations. (a, d) A distinctly different LD pattern is observed between NEAC and NCC in LG1 and 12. (b, c) The LD pattern is similar within LG2 and 7 between NEAC and NCC. Corresponding patterns for all other linkage groups and for North Sea cod are shown in Supplementary Fig. S3 while the underlying LD measurements are found in Supplementary Table S5. NEAC = Northeast Arctic cod, NCC = Norwegian coastal cod.
Figure 6
Figure 6. The population structuring within the rearranged regions in LG1, 2, 7 and 12 in Atlantic cod.
The first two prinsipal components obtained from PCA of the NEAC, NCC and NS populations, using markers within the rearranged regions in the respective LGs. Each dot represents an individual and the left and right hand clusters represents the homozygotes while the middle cluster represents the heterozygotes. Corresponding patterns for all other linkage groups are shown in Supplementary Fig. S5. NEAC = Northeast Arctic cod, NCC = Norwegian coastal cod, NS = North Sea cod.

References

    1. Hohenlohe P. A. et al.. Population Genomics of Parallel Adaptation in Threespine Stickleback using Sequenced RAD Tags. Plos Genet 6, e1000862 (2010). - PMC - PubMed
    1. Jones F. C. et al.. The genomic basis of adaptive evolution in threespine sticklebacks. Nature 484, 55–61 (2012). - PMC - PubMed
    1. Nadeau N. J. et al.. Genomic islands of divergence in hybridizing Heliconius butterflies identified by large-scale targeted sequencing. Phil Trans R Soc B 367, 343–353 (2012). - PMC - PubMed
    1. Berg P. R. et al.. Adaptation to Low Salinity Promotes Genomic Divergence in Atlantic Cod (Gadus morhua L.). Genome Biol Evol 7, 1644–1663 (2015). - PMC - PubMed
    1. Wu C.-I. The genic view of the process of speciation. J. Evol. Biol. 14, 851–865 (2001).

Publication types

LinkOut - more resources