. 2016 Mar 16:16:226.
doi: 10.1186/s12885-016-2273-6.

Epigenetic silencing of miR-181c by DNA methylation in glioblastoma cell lines

Affiliations

Epigenetic silencing of miR-181c by DNA methylation in glioblastoma cell lines

Erandi Ayala-Ortega et al. BMC Cancer. .

Abstract

Background: Post-transcriptional regulation by microRNAs is recognized as one of the major pathways for the control of cellular homeostasis. Less well understood is the transcriptional and epigenetic regulation of genes encoding microRNAs. In the present study we addressed the epigenetic regulation of the miR-181c in normal and malignant brain cells.

Methods: To explore the epigenetic regulation of the miR-181c we evaluated its expression using RT-qPCR and the in vivo binding of the CCCTC-binding factor (CTCF) to its regulatory region in different glioblastoma cell lines. DNA methylation survey, chromatin immunoprecipitation and RNA interference assays were used to assess the role of CTCF in the miR-181c epigenetic silencing.

Results: We found that miR-181c is downregulated in glioblastoma cell lines, as compared to normal brain tissues. Loss of expression correlated with a notorious gain of DNA methylation at the miR-181c promoter region and the dissociation of the multifunctional nuclear factor CTCF. Taking advantage of the genomic distribution of CTCF in different cell types we propose that CTCF has a local and cell type specific regulatory role over the miR-181c and not an architectural one through chromatin loop formation. This is supported by the depletion of CTCF in glioblastoma cells affecting the expression levels of NOTCH2 as a target of miR-181c.

Conclusion: Together, our results point to the epigenetic role of CTCF in the regulation of microRNAs implicated in tumorigenesis.

Keywords: CCCTC-binding factor (CTCF); DNA methylation; Epigenetics; Glioblastoma cells; RNA interference.


Figures

Fig. 1
Fig. 1
CTCF binds to the promoter of miR-181c. a IGV genome browser screenshot for ChIP-seq data of H3K4me3, H3K27ac, CTCF and Rad21 from K562 cells and Reduced Representation Bisulfite Sequencing (RRBS) data from the same cell line. Green bars, 0 % molecules sequenced are methylated; Yellow bars, 50 % molecules are methylated; Red bars, 100 % molecules sequenced are methylated. CTCF binding motif with the highest score is shown with reference to one CpG island. The region depicted is chr19:13,982,729-13,985,645. Data was downloaded from the Analysis/Data hub by the ENCODE project. b primiR-181c expression levels in different cells measured by RT-qPCR with SYBR Green. c miR-181c expression levels in different cells measured by Taqman assay
Fig. 2
Fig. 2
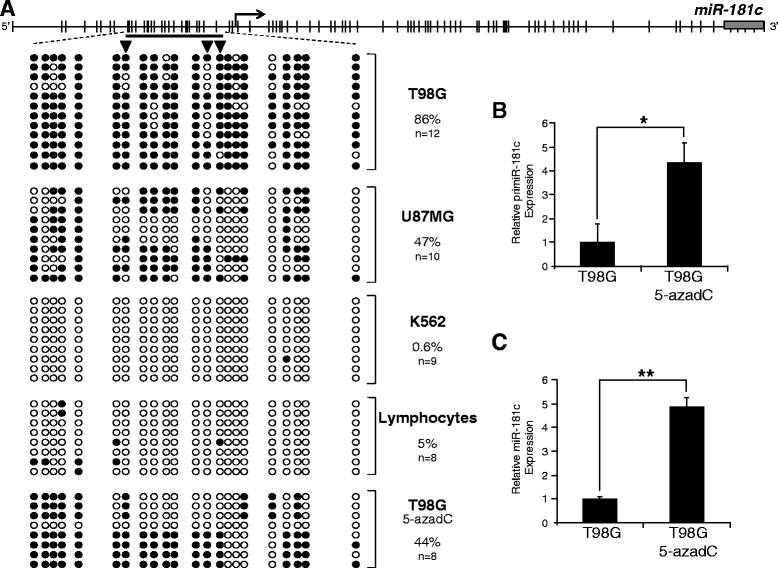
DNA methylation of the miR-181c promoter region. a Scheme of the distribution of CpGs upstream the transcription start site and over the gene body of miR-181c. DNA methylation profile of miR-181c promoter region in different cell types. The analyzed region is demarcated by the black line upstream the transcription start site which represents a CpG island. A range of 8 to 12 independent clones were sequenced for each cell type. Black circles represent methylated CpGs; white circles represent non-methylated CpGs. The black triangles point to the CpGs that overlap with a CTCF binding motif and have a high level of methylation in T98G. b primiR-181c expression level in T98G cells and the T98G treated with 5-aza-2′-deoxycytidine, measured by RT-qPCR with SYBR Green. c miR-181c expression level in T98G cells and T98G treated with 5-aza-2′-deoxycytidine, measured with Taqman assay. *p-value < 0.05; **p-value < 0.01
Fig. 3
Fig. 3
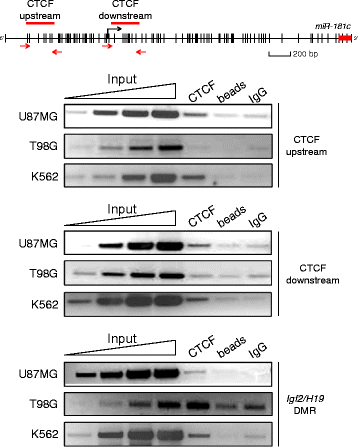
In vivo CTCF binding to the promoter region of the miR-181c. Chromatin immunoprecipitation against CTCF in U87MG, T98G glioblastoma cells and K562 erythroleukemic cells are shown. The enrichment was evaluated in what we designated as the CTCF-upstream and the CTCF-downstream predicted sites in relation to the transcription start site of primiR-181c. The black arrows of the scheme show the location of primers used for PCR amplification. The linear range of Input DNA amplification products is shown. Igf2/H19 DMR was used as a positive control for CTCF in vivo enrichment. This set of data is representative of at least three independent experiments
Fig. 4
Fig. 4
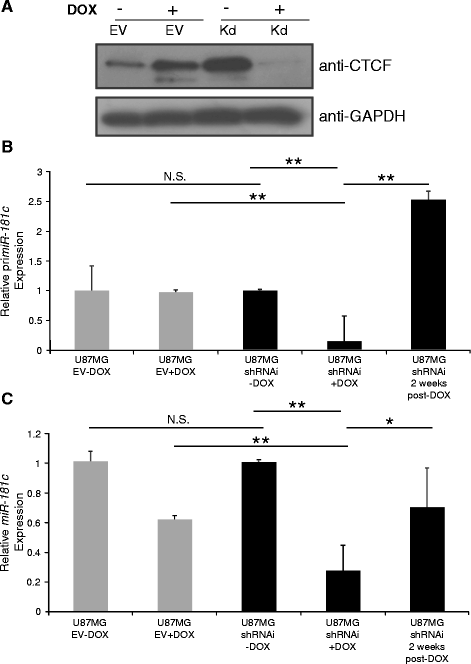
Inducible knockdown of human CTCF in U87MG glioblastoma cell line affects miR-181c expression. a Western blot shows CTCF protein levels in U87MG cells transduced with an inducible Empty Vector (EV) with and without Doxycycline (DOX) induction as controls. U87MG cells were also transduced with an inducible shRNAi against CTCF without (−DOX) and with (+DOX) Doxycycline (DOX). b primiR-181c expression levels in cell pools containing the inducible shRNAi against CTCF. No treatment (U87MG/shRNAi), treatment (U87MG/shRNAi/+DOX) and 2 weeks after Doxycycline deprivation (U87MG/shRNAi/2 weeks/post-DOX) were measured by RT-qPCR with SYBR Green. Empty vector controls are shown (U87MG/EV-DOX and U87MG/EV + DOX). N.S., not significant. c The miR-181c expression levels were evaluated under the same experimental conditions as in (b) using the Taqman assay. *p-value < 0.05 and **p-value < 0.01
Fig. 5
Fig. 5
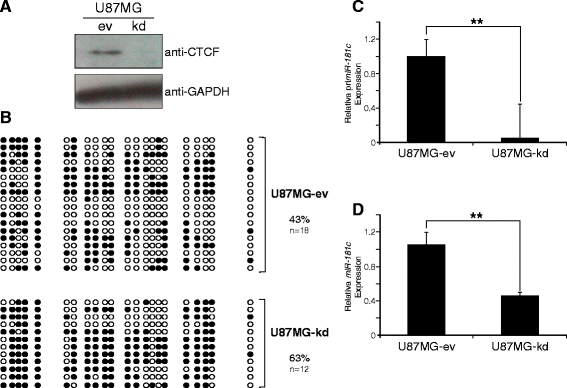
CTCF depletion results in increased promoter methylation and decreased expression of miR-181c. a Western-blot showing the levels of CTCF protein in cells infected by a lentiviral system expressing a shRNAi against CTCF. b Comparative DNA methylation analysis of the miR-181c promoter region. The percentage of methylated CpGs is shown for knockdown cells (U87MG-kd) and control cells (U87MG-ev). Black circles correspond to methylated CpGs and white circles to unmethylated CpGs. c primiR-181c expression levels measured by RT-qPCR with SYBR Green. d miR-181c expression levels measured by Taqman Assay. **p-value < 0.01
Fig. 6
Fig. 6
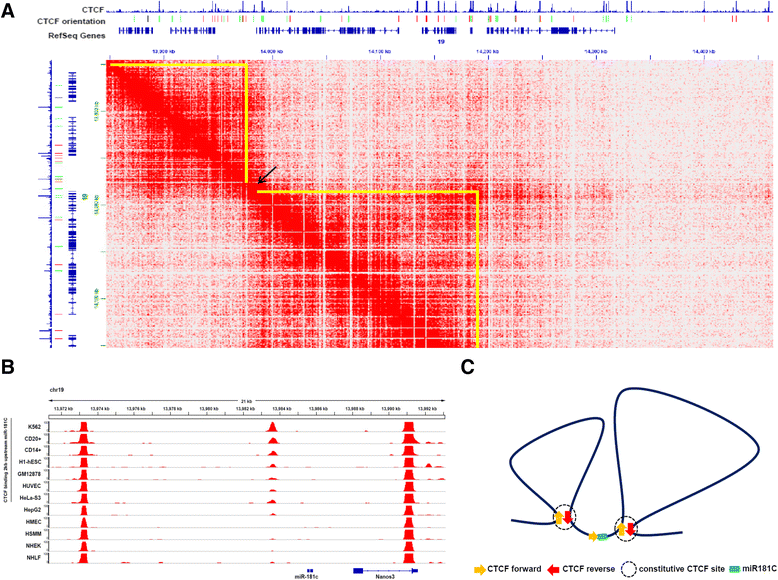
Two chromatin loops flank miR-181c in GM12878 cells. a Screenshot from JuiceBox in situ Hi-C data display of GM12878 cell line at 5 kb resolution. Yellow triangles represent chromatin loops. MiR-181c is represented by an arrow. Note that miR-181c as well as its promoter and CTCF proximal binding site are located in the transition between two chromatin loops. Left loop, chr19: 13855001–13975000; Right loop, chr19: 13990001–14185000. b IGV genome browser screenshot for ChIP-seq data of CTCF in 12 different cell lines. Signal tracks are displayed for each cell line. Two constitutive binding sites of CTCF flank the dynamic CTCF binding site for miR-181C. The constitutive sites correspond to the anchors of the chromatin loops as shown in (a). Data downloaded from the Analysis Data hub by the ENCODE project. c Model of two chromatin loops flanking miR-181c
Fig. 7
Fig. 7
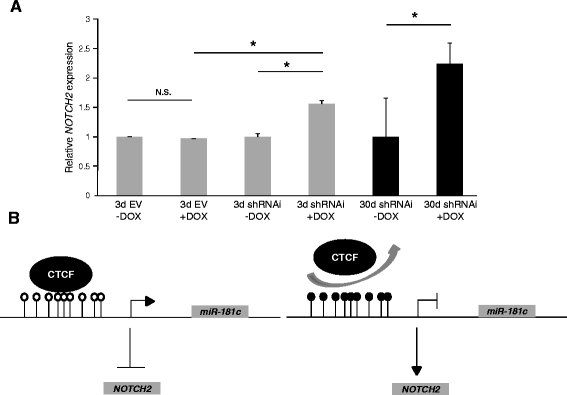
Depletion of CTCF in U87MG cells affects the transcription levels of NOTCH2. a NOTCH2 mRNA levels in U87MG cells transduced with an inducible shRNAi against CTCF after 3 and 30 days with or without DOX induction (3d shRNAi-DOX; 3d shRNAi + DOX; 30d shRNAi-DOX; 30d shRNAi + DOX). Empty vector controls are shown (3d EV-DOX and 3d EV + DOX). *p-value < 0.05. N.S., not significant. This set of data is representative of three-independent experiments. b In U87MG cells CTCF binds to the promoter region of miR-181c (Left). Loss of CTCF causes epigenetic silencing of miR-181c by DNA methylation and an increase of NOTCH2 mRNA (Right)

References

    1. Jansson MD, Lund AH. MicroRNA and cancer. Mol Oncol. 2012;6(6):590–610. doi: 10.1016/j.molonc.2012.09.006. - DOI - PMC - PubMed
    1. Suzuki H, Maruyama R, Yamamoto E, Kai M. Epigenetic alteration and microRNA deregulation in cancer. Front Genet. 2013;4:258. doi: 10.3389/fgene.2013.00258. - DOI - PMC - PubMed
    1. Benetatos L, Voulgaris E, Vartholomatos G, Hatzimichael E. Non-coding RNAs and EZH2 interactions in cancer: long and short tales from the transcriptome. Int J Cancer. 2013;133(2):267–74. doi: 10.1002/ijc.27859. - DOI - PubMed
    1. Di Leva G, Garofalo M, Croce CM. MicroRNAs in cancer. Ann Rev Pathol Mech Dis. 2014;9:287–314. doi: 10.1146/annurev-pathol-012513-104715. - DOI - PMC - PubMed
    1. Denis H, Ndlovu MN, Fuks F. Regulation of mammalian DNA methyltransferases: a route to new mechanisms. EMBO Rep. 2011;12(7):647–56. doi: 10.1038/embor.2011.110. - DOI - PMC - PubMed

Publication types

LinkOut - more resources