. 2016 Jun;15(6):1895-912.
doi: 10.1074/mcp.M116.058016. Epub 2016 Mar 16.

Integrated Omics and Computational Glycobiology Reveal Structural Basis for Influenza A Virus Glycan Microheterogeneity and Host Interactions

Affiliations

Integrated Omics and Computational Glycobiology Reveal Structural Basis for Influenza A Virus Glycan Microheterogeneity and Host Interactions

Kshitij Khatri et al. Mol Cell Proteomics. 2016 Jun.

Abstract

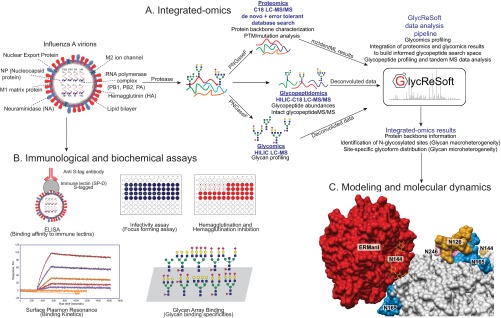
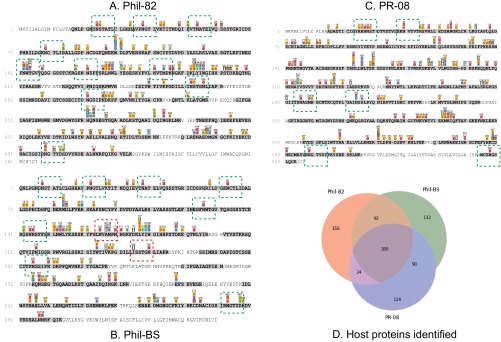
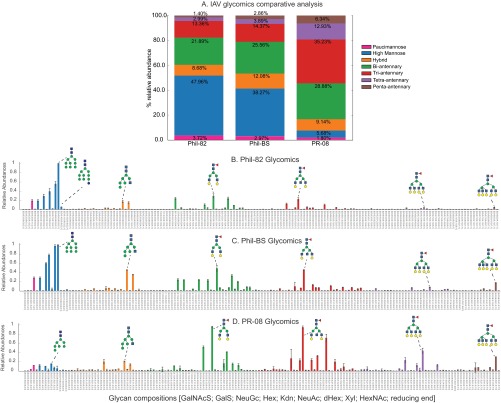
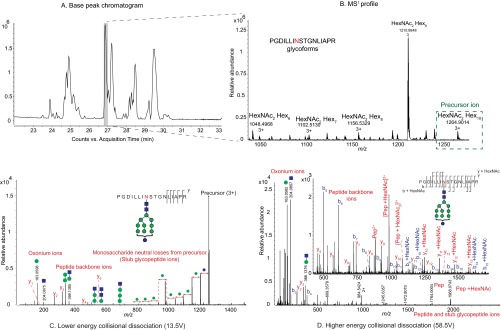
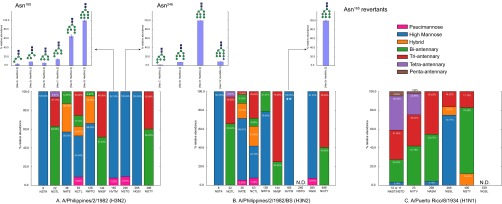
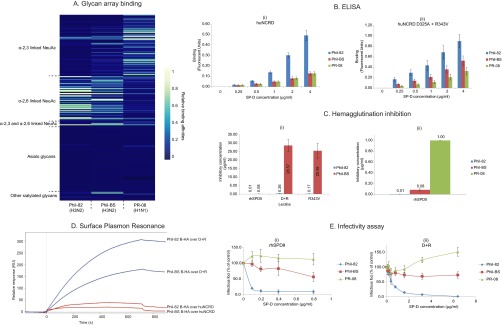
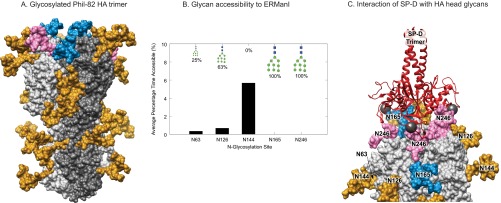
Despite sustained biomedical research effort, influenza A virus remains an imminent threat to the world population and a major healthcare burden. The challenge in developing vaccines against influenza is the ability of the virus to mutate rapidly in response to selective immune pressure. Hemagglutinin is the predominant surface glycoprotein and the primary determinant of antigenicity, virulence and zoonotic potential. Mutations leading to changes in the number of HA glycosylation sites are often reported. Such genetic sequencing studies predict at best the disruption or creation of sequons for N-linked glycosylation; they do not reflect actual phenotypic changes in HA structure. Therefore, combined analysis of glycan micro and macro-heterogeneity and bioassays will better define the relationships among glycosylation, viral bioactivity and evolution. We present a study that integrates proteomics, glycomics and glycoproteomics of HA before and after adaptation to innate immune system pressure. We combined this information with glycan array and immune lectin binding data to correlate the phenotypic changes with biological activity. Underprocessed glycoforms predominated at the glycosylation sites found to be involved in viral evolution in response to selection pressures and interactions with innate immune-lectins. To understand the structural basis for site-specific glycan microheterogeneity at these sites, we performed structural modeling and molecular dynamics simulations. We observed that the presence of immature, high-mannose type glycans at a particular site correlated with reduced accessibility to glycan remodeling enzymes. Further, the high mannose glycans at sites implicated in immune lectin recognition were predicted to be capable of forming trimeric interactions with the immune-lectin surfactant protein-D.


Figures

Fig. 1.
Fig. 1.
Experimental Workflow. A, Integrated-omics: Workflow for acquiring and combining proteomics, glycomics and glycopeptidomics information to enable confident assignment of site-specific glycoforms; B, Immunological and biochemical assays used for correlating changes in virus glycosylation with bioactivity; C, Modeling and molecular dynamics simulations driven by structural information from integrated-omics analyses to understand structural basis for host-virus interactions and glycan processing at important sites. Graphic shows ERManI interacting with the glycan at Asn144 on the head region of a Phil-82 hemagglutinin trimer.
Fig. 2.
Fig. 2.
Proteomics results. Proteomics coverage of Phil-82 (A), Phil-BS (B) and PR-08 (C) hemagglutinins. Portions of sequence covered are highlighted in gray, with colored symbols above the sequence rows representing modifications and mutations. Green boxes show N-glycosylation sequons and red boxes indicate mutated/disrupted sequons in Phil-BS; D: Total number of proteins including host-proteins identified in proteomics of the three IAV samples. Only IAV and chicken (Gallus gallus) proteins identified with 2 or more unique peptides were counted.
Fig. 3.
Fig. 3.
Glycomics results from negative mode LC-MS profiling of released IAV N-glycans. A, Comparison of the three strains. Stacked bars represent mean composite relative abundances of different glycan classes, categorized by HexNAc and Hexose units in the identified glycan compositions (Paucimannose: HexNAc = 2, Hexose < = 4; High Mannose: HexNAc = 2, Hexose > = 5; Hybrid: HexNAc = 3; Bi-antennary: HexNAc = 4; Tri-antennary: HexNAc = 5; Tetra-antennary: HexNAc = 6 and Penta-antennary: HexNAc = 7). Bar plots show individual glycan relative abundances for B, Phil-82; C, Phil-BS; D, PR-08. Colored bars represent mean abundances relative to the most abundant composition detected for each sample. Error bars represent standard deviation. The most abundant glycoforms in each category are labeled with putative topologies using the Consortium for Functional Glycomics glycan representation scheme.
Fig. 4.
Fig. 4.
Glycoproteomics analysis data dimensions. A, Chromatographic separation and associated peak areas of enriched Phil-82 IAV glycopeptides; B, MS1 profiling and intact mass assignments of Phil-82 hemagglutinin glycopeptide PGDILLINSTGNLIAPR glycoforms; Tandem MS of glycopeptide PGDILLINSTGNLIAPR - Hex10HexNAc2 showing product ions resulting from lower-energy collisional dissociation (C) and higher-energy collisional dissociation (D). Glycan topologies shown are speculative based on inferred glycan compositions.
Fig. 5.
Fig. 5.
Integrated-omics results. Site-specific glycan distributions for hemagglutinins. A, Phil-82; B, Phil-BS; C, PR-08. Stacked bars represent composite mean relative abundances for N-glycan compositions categorized by number of HexNAc units, as described above. All stacked bars have been scaled to 100% to represent percentages of individual glycan classes among all glycans identified. Insets show individual glycoform relative abundances for sites identified in the interaction with immune-lectins. Error bars represent standard deviation in three measurements of glycoform abundances. N.D.: Not Detected. **Revertant population at site 165 in Phil-BS.
Fig. 6.
Fig. 6.
Results from biochemical, virological and immunological assays. A, CFG glycan array analysis of three IAV strains. Only glycans where relative binding was greater than 0.1% for any one of the three strains have been included in the heat-map. Array glycans are sorted into different categories (y-axis) and the three virus strains are listed on x-axis; B, ELISA results. Bar-charts show dose-dependent binding to human surfactant protein-D NCRD wild-type (i) and double mutant D+R (ii). X-axis shows the concentration of SP-D used and Y-axis shows binding response in fluorescent units measured. Error bars represent standard error; C, Hemagglutination inhibition of IAV strains. (i) Comparison of inhibitory effect of different lectins on Phil-82 and Phil-BS. (ii) HA inhibitory concentrations of rhSPDII for the three IAV strains studied. Error bars represent standard error; D, Surface Plasmon Resonance results. Bromelain cleaved hemagglutinin (B-HA) from Phil-82 and Phil-BS, were introduced in the mobile phase and binding toward immobilized wild type or mutant NCRDs was measured; E, Infectivity assay results. Infectivity of the three IAV strains was compared after pre-incubation with increasing concentrations of (i) rhSPDII and (ii) D+R mutant SP-D. Data points show infectivity measured as infectious foci expressing influenza nucleoprotein, relative to control (no SP-D pre-incubation).
Fig. 7.
Fig. 7.
Structure modeling and molecular dynamics results. A, 3D model of glycosylated Phil-82 hemagglutinin trimer. One HA monomer is shown in dark gray. Glycans at Asn165 and Asn246 are shown in blue and pink, respectively. B, Percentage of simulation time that an N-glycan is accessible to ERManI. The values are averaged over each protomer of the H3 trimer. The amount of Man9GlcNAc2 at each site is depicted on the upper axis, demonstrating that increased accessibility to ERManI correlates with less Man9GlcNAc2 at each site. C, A model of trimeric SP-D (red ribbons) bound to three N-glycans on the H3 head domain (light gray surface). The 3D structure of the glycosylated H3 was taken from the MD simulation. In this snapshot, Manα residues at sites Asn246, Asn165, and Asn246 on different protomers were ∼45 Å apart, such that SP-D could bind each residue simultaneously. The calcium atoms found in each SP-D Manα binding site are shown (dark gray spheres).

References

    1. Blackburne B. P., Hay A. J., and Goldstein R. A. (2008) Changing selective pressure during antigenic changes in human influenza H3. PLoS Pathog. 4, e1000058. - PMC - PubMed
    1. Cherry J. L., Lipman D. J., Nikolskaya A., and Wolf Y. I. (2009) Evolutionary dynamics of N-glycosylation sites of influenza virus hemagglutinin. PLoS Curr. 1, RRN1001. - PMC - PubMed
    1. Vigerust D. J., and Shepherd V. L. (2007) Virus glycosylation: role in virulence and immune interactions. Trends Microbiol. 15, 211–218 - PMC - PubMed
    1. Wei C. J., Boyington J. C., Dai K., Houser K. V., Pearce M. B., Kong W. P., Yang Z. Y., Tumpey T. M., and Nabel G. J. (2010) Cross-neutralization of 1918 and 2009 influenza viruses: role of glycans in viral evolution and vaccine design. Sci. Transl. Med. 2, 24ra21–24ra21 - PMC - PubMed
    1. Magadán J. G., Altman M. O., Ince W. L., Hickman H. D., Stevens J., Chevalier A., Baker D., Wilson P. C., Ahmed R., Bennink J. R., and Yewdell J. W. (2014) Biogenesis of influenza A virus hemagglutinin cross-protective stem epitopes. PLoS Pathog. 10, e1004204. - PMC - PubMed

Publication types