Measuring the intrarenal distribution of glomerular volumes from histological sections
- PMID: 26984953
- PMCID: PMC4935774
- DOI: 10.1152/ajprenal.00382.2015
Measuring the intrarenal distribution of glomerular volumes from histological sections
Abstract
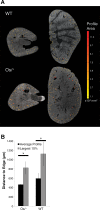
Glomerular volume is an important metric reflecting glomerular filtration surface area within the kidney. Glomerular hypertrophy, or increased glomerular volume, may be an important marker for renal stress. Current stereological techniques report the average glomerular volume (AVglom) within the kidney. These techniques cannot assess the spatial or regional heterogeneity common in developing renal pathology. Here, we report a novel "unfolding" technique to measure the actual distribution of individual glomerular volumes in a kidney from the two-dimensional glomerulus profiles observed by optical microscopy. The unfolding technique was first developed and tested for accuracy with simulations and then applied to measure the number of glomeruli (Nglom), AVglom, and intrarenal distribution of individual glomerular volume (IVglom) in the oligosyndactyl (Os/(+)) mouse model compared with wild-type (WT) controls. The Os/(+) mice had fewer and larger glomeruli than WT mice: Nglom was 12,126 ± 1,658 (glomeruli/kidney) in the WT mice and 5,516 ± 899 in the Os/(+) mice; AVglom was 2.01 ± 0.28 × 10(-4) mm(3) for the WT mice and 3.47 ± 0.35 × 10(-4) mm(3) for the Os/(+) mice. Comparing the glomerular volume distributions in Os/(+) and WT kidneys, we observed that the Os/(+) distribution peaked at a higher value of IVglom than the WT distribution peak, and glomeruli with a radius greater than 55 μm were more prevalent in the Os/(+) mice (3.4 ± 1.6% of total glomeruli vs. 0.6 ± 1.2% in WT). Finally, the largest profiles were more commonly found in the juxtamedullary region. Unfolding is a novel stereological technique that provides a new quantitative view of glomerular volume distribution in the individual kidney.
Keywords: chronic kidney disease; glomerular hypertrophy; glomerular volume distribution; kidney stereology; nephron number; unfolding algorithm.
Copyright © 2016 the American Physiological Society.
Figures


Similar articles
-
In vivo measurements of kidney glomerular number and size in healthy and Os/+ mice using MRI.Am J Physiol Renal Physiol. 2019 Oct 1;317(4):F865-F873. doi: 10.1152/ajprenal.00078.2019. Epub 2019 Jul 24. Am J Physiol Renal Physiol. 2019. PMID: 31339774 Free PMC article.
-
Measuring glomerular number and size in perfused kidneys using MRI.Am J Physiol Renal Physiol. 2011 Jun;300(6):F1454-7. doi: 10.1152/ajprenal.00044.2011. Epub 2011 Mar 16. Am J Physiol Renal Physiol. 2011. PMID: 21411479
-
Nephron number, glomerular volume, renal disease and hypertension.Curr Opin Nephrol Hypertens. 2008 May;17(3):258-65. doi: 10.1097/MNH.0b013e3282f9b1a5. Curr Opin Nephrol Hypertens. 2008. PMID: 18408476 Review.
-
Combining new tools to assess renal function and morphology: a holistic approach to study the effects of aging and a congenital nephron deficit.Am J Physiol Renal Physiol. 2017 Sep 1;313(3):F576-F584. doi: 10.1152/ajprenal.00329.2015. Epub 2017 May 10. Am J Physiol Renal Physiol. 2017. PMID: 28490528
-
Pathways to nephron loss starting from glomerular diseases-insights from animal models.Kidney Int. 2005 Feb;67(2):404-19. doi: 10.1111/j.1523-1755.2005.67097.x. Kidney Int. 2005. PMID: 15673288 Review.
Cited by
-
In vivo measurements of kidney glomerular number and size in healthy and Os/+ mice using MRI.Am J Physiol Renal Physiol. 2019 Oct 1;317(4):F865-F873. doi: 10.1152/ajprenal.00078.2019. Epub 2019 Jul 24. Am J Physiol Renal Physiol. 2019. PMID: 31339774 Free PMC article.
-
Automated Image Analyses of Glomerular Hypertrophy in a Mouse Model of Diabetic Nephropathy.Kidney360. 2020 May 1;1(6):469-479. doi: 10.34067/KID.0001272019. eCollection 2020 Jun 25. Kidney360. 2020. PMID: 35368599 Free PMC article.
-
CXCL12 blockade preferentially regenerates lost podocytes in cortical nephrons by targeting an intrinsic podocyte-progenitor feedback mechanism.Kidney Int. 2018 Dec;94(6):1111-1126. doi: 10.1016/j.kint.2018.08.013. Epub 2018 Oct 29. Kidney Int. 2018. PMID: 30385042 Free PMC article.
References
-
- Baldelomar EJ, Charlton JR, Beeman SC, Hann BD, Cullen-McEwen L, Pearl VM, Bertram JF, Wu T, Zhang M, Bennett KM. Phenotyping by magnetic resonance imaging nondestructively measures glomerular number and volume distribution in mice with and without nephron reduction. Kidney Int 89: 498–505, 2016. - PMC - PubMed
-
- Beeman SC, Cullen-McEwen LA, Puelles VG, Zhang M, Wu T, Baldelomar EJ, Dowling J, Charlton JR, Forbes MS, Ng A, Wu QZ, Armitage JA, Egan GF, Bertram JF, Bennett KM. MRI-based glomerular morphology and pathology in whole human kidneys. Am J Physiol Renal Physiol 306: F1381–F1390, 2014. - PMC - PubMed
-
- Beeman SC, Zhang M, Gubhaju L, Wu T, Bertram JF, Frakes DH, Cherry BR, Bennett KM. Measuring glomerular number and size in perfused kidneys using MRI. Am J Physiol Renal Physiol 300: F1454–F1457, 2011. - PubMed
-
- Bertram JF, Young RJ, Seymour AE, Kincaid-Smith P, Hoy W. Glomerulomegaly in Australian Aborigines. Nephrology 4: S46–S53, 1998.
Publication types
MeSH terms
LinkOut - more resources
Full Text Sources
Other Literature Sources
Medical
Molecular Biology Databases

