. 2016 Mar 16;36(11):3350-62.
doi: 10.1523/JNEUROSCI.3390-15.2016.

The Severity of Acute Stress Is Represented by Increased Synchronous Activity and Recruitment of Hypothalamic CRH Neurons

Affiliations

The Severity of Acute Stress Is Represented by Increased Synchronous Activity and Recruitment of Hypothalamic CRH Neurons

Colette M Vom Berg-Maurer et al. J Neurosci. .

Abstract

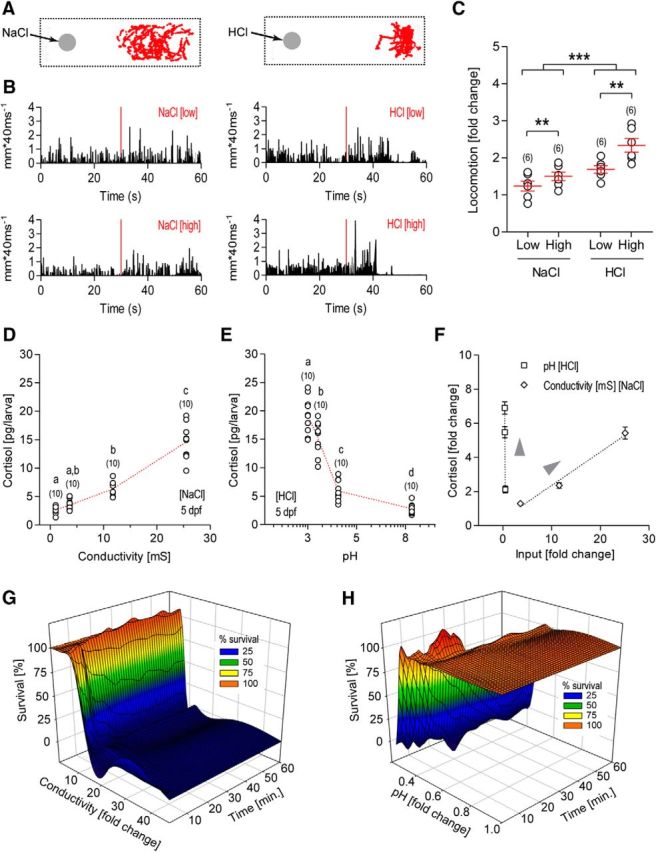
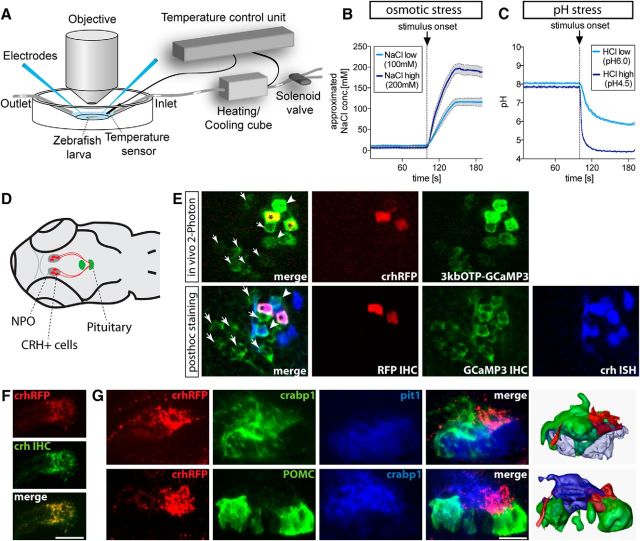
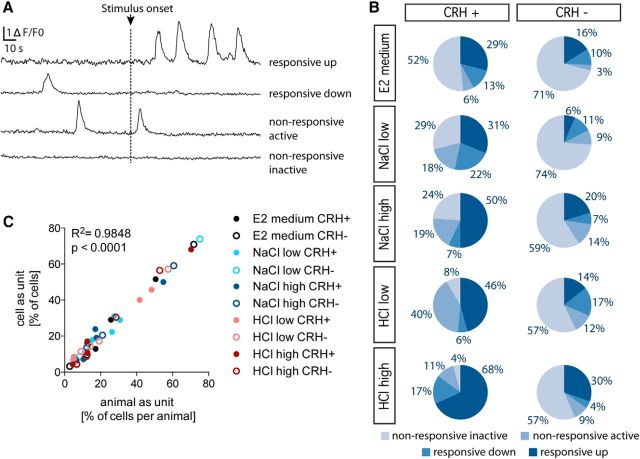
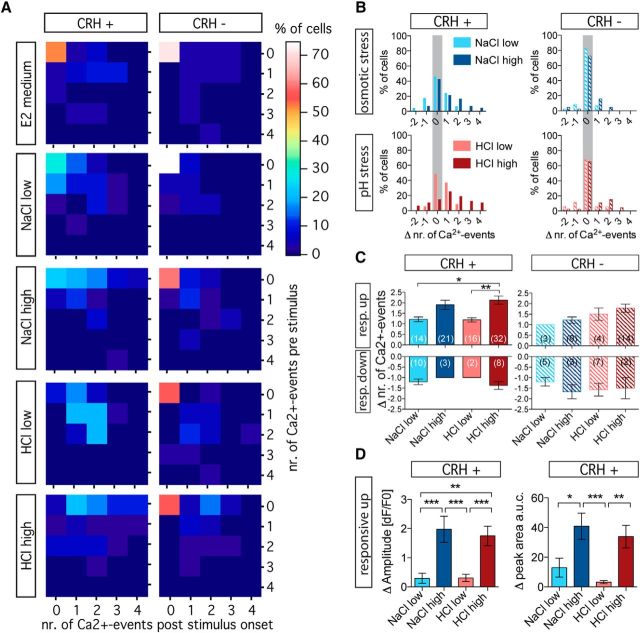
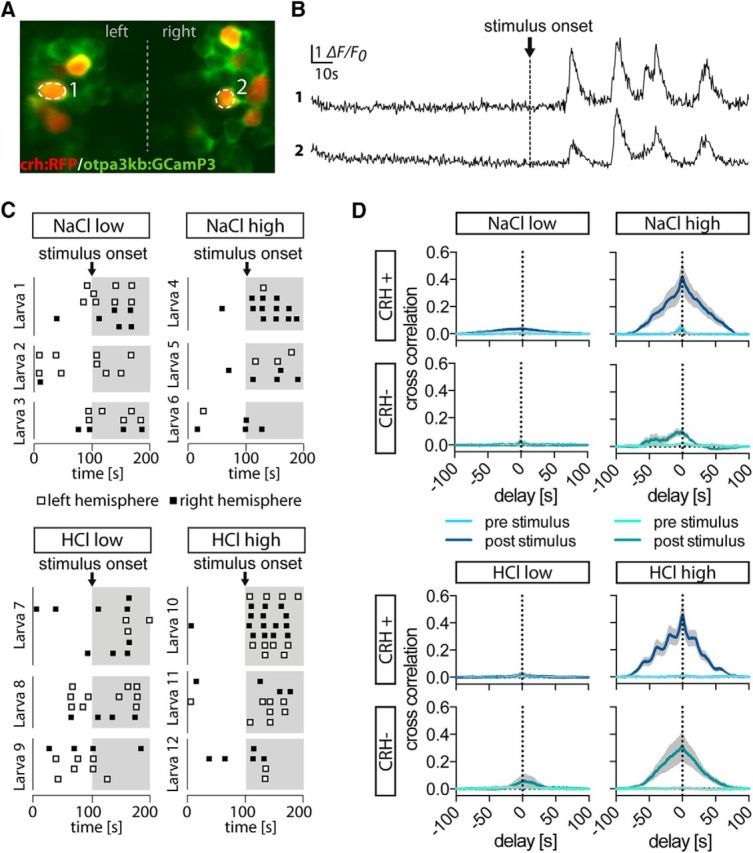
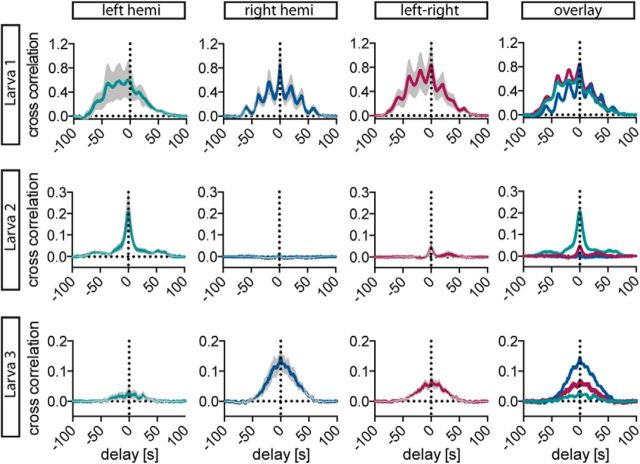
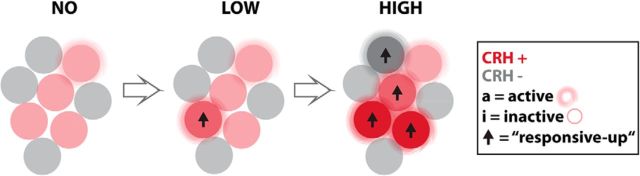
The hypothalamo-pituitary-adrenocortical (HPA) axis regulates stress physiology and behavior. To achieve an optimally tuned adaptive response, it is critical that the magnitude of the stress response matches the severity of the threat. Corticotropin-releasing hormone (CRH) released from the paraventricular nucleus of the hypothalamus is a major regulator of the HPA axis. However, how CRH-producing neurons in an intact animal respond to different stressor intensities is currently not known. Using two-photon calcium imaging on intact larval zebrafish, we recorded the activity of CRH cells, while the larvae were exposed to stressors of varying intensity. By combining behavioral and physiological measures, we first determined how sudden alterations in environmental conditions lead to different levels of stress axis activation. Then, we measured changes in the frequency and amplitude of Ca(2+) transients in individual CRH neurons in response to such stressors. The response magnitude of individual CRH cells covaried with stressor intensity. Furthermore, stressors caused the recruitment of previously inactive CRH neurons in an intensity-dependent manner, thus increasing the pool of responsive CRH cells. Strikingly, stressor-induced activity appeared highly synchronized among CRH neurons, and also across hemispheres. Thus, the stressor strength-dependent output of CRH neurons emerges by a dual mechanism that involves both the increased activity of individual cells and the recruitment of a larger pool of responsive cells. The synchronicity of CRH neurons within and across hemispheres ensures that the overall output of the HPA axis matches the severity of the threat.

Significance statement: Stressors trigger adaptive responses in the body that are essential for survival. How the brain responds to acute stressors of varying intensity in an intact animal, however, is not well understood. We address this question using two-photon Ca(2+) imaging in larval zebrafish with transgenically labeled corticotropin-releasing hormone (CRH) cells, which represent a major regulator of the stress axis. We show that stressor strength-dependent responses of CRH neurons emerge via an intensity-dependent increase in the activity of individual CRH cells, and by an increase in the pool of responsive CRH cells at the population level. Furthermore, we report striking synchronicity among CRH neurons even across hemispheres, which suggests tight intrahypothalamic and interhypothalamic coordination. Thus, our work reveals how CRH neurons respond to different levels of acute stress in vivo.

Keywords: HPA axis; calcium imaging; corticotropin releasing hormone; stress; synchronicity; zebrafish.


Figures

Figure 1.
Figure 1.
Salinity and pH changes trigger behavioral and physiological stress reactions. A, Representative traces of larvae after the addition of a drop of concentrated NaCl (left) or HCl (right) solution to the medium, showing that larvae avoid the spot where the drop has been placed (gray circles). Depicted in red are x–y coordinates during 180 s. Avoidance was more pronounced after delivery of concentrated HCl solution compared with concentrated NaCl solution. B, Representative motion traces of a single larva before and after perfusion with NaCl (left) or HCl (right) solutions (perfusion onset is indicated by red lines) of different concentrations. C, Locomotion (measured as a fold change: average motion 10 s after the addition of either HCl or NaCl/average motion 10 s before the addition of either HCl or NaCl) increased shortly after the global addition of concentrated solution to the medium. For the conditions chosen here, locomotion changes were more pronounced following a change in pH compared with a change in salinity; for both types of stressors, locomotion increased as NaCl or HCl concentration increased. The data are presented as the mean ± SEM (asterisks indicate significant differences; sample size is in parentheses). D, E, Changes in salinity (D) or pH (E) elicited a dose-dependent increase in whole-body cortisol concentration in larvae. Red lines connect means, bracketed numbers represent sample size (one data point represents a group of 30 larvae), and letters designate the results of the post hoc comparisons. Data points with different letters indicate significant differences, while data points with the same letters do not. F, Differences in responses to pH and salinity became apparent when input fold change was plotted against cortisol fold change (i.e., small changes in pH induced large changes in cortisol levels, while larger changes in conductivity were required to produce an effect of the same magnitude). G, H, Acidification and salinity changes compromised survival in a dose- and time-dependent manner.
Figure 2.
Figure 2.
Stressor-induced neuronal activity of CRH-positive cells can be assessed using two-photon Ca2+ imaging. A, Schematic view of the imaging chamber. B, Changes in the liquid junction potential were measured to determine the time course of changes in NaCl concentration in the imaging chamber. The data shown are the averaged stimulus traces of eight experiments for each condition (the mean ± SEM are shown as lines and shaded background). C, Average traces of n = 9 experiemtns (HClhigh) and n = 14 experiments (HCllow) are shown. The means ± SEM are shown as lines and shaded background. D, Schematic drawing of a larval head to illustrate CRH-positive cells (red) in the NPO (gray), some of which innervate the pituitary gland where they contact corticotrophs (green). E, Red-labeled CRH cells (asterisk) were identified in the Tg(crh:RFP); Tg(otpa3kb:GCaMP3.0) line in vivo (top) among other NPO cells (green). The same fish is shown after post hoc staining (bottom) of RFP (red), GCaMP (green), and CRH (blue), with transgenically labeled CRH cells (asterisk) used as landmarks to distinguish unlabeled CRH cells (arrowheads) from CRH-negative NPO cells (arrows). F, IHC against CRH (green) and RFP (red) shows complete colocalization in the pituitary, indicating that RFP fibers in the pituitary originate from CRH rather than falsely labeled RFP cells. Scale bar, 50 μm. G, Top, ISH labeling with markers for the neurohypophysis (crabp1, green) and the adenohypophysis (pit1, blue), together with RFP-labeled fibers (red), show the exact target site of CRH neurons in the pituitary gland. Bottom, Red-labeled CRH:RFP fibers with green-labeled POMC-positive corticotrophs and a blue-labeled neurohypophysis show innervation of the posterior corticotroph cluster. Right panels are 3D reconstructions of confocal stacks. Lateral views of the pituitary gland (anterior is to the left) are shown. Scale bar, 20 μm.
Figure 3.
Figure 3.
Stressors lead to increased neuronal activity and recruitment of CRH cells. A, Representative fluorescent traces of four CRH cells over 200 s with stimulus onset after 100 s. The number of Ca2+ events was quantified and used to categorize cells into the four categories indicated on the right. B, The number of cells in each category was quantified as a percentage of the total number of cells (CRH-positive E2 medium, n = 31; CRH-negative E2 medium, n = 31; CRH-positive NaCllow, n = 45; CRH-negative NaCllow, n = 46; CRH-positive NaClhigh, n = 42; CRH- negative NaClhigh, n = 44; CRH-positive HCllow, n = 35; CRH-negative HCllow, n = 35; CRH-positive HClhigh, n = 47; CRH-negative HClhigh, n = 46). C, Comparison of the number of cells that fell within each category when individual cells vs larvae were used as experimental units. The numbers in each category deviated only slightly (Pearson's correlation). Each of the 10 conditions indicated in the figure encompass four data points corresponding to the four categories (responsive up, responsive down, nonresponsive active, and nonresponsive inactive).
Figure 4.
Figure 4.
Recruitment of inactive CRH cells and the magnitude of activity change covary with stressor intensity. A, Histograms showing how cell distribution changed relative to basal (number of Ca2+ events prestimulus) and stimulus-induced (number of Ca2+ events poststimulus) activity. B, Frequency distribution histograms show that as stressor intensity increased, the number of nonresponsive CRH-positive cells decreased, and the magnitude of change in the number of Ca2+ events increased. In contrast, most CRH-negative cells remained nonresponsive, regardless of stressor intensity. Shaded in gray are nonresponsive cells (active and inactive) that did not show a change in the number of Ca2+ events in response to the stimulus. C, The response magnitude of CRH-positive cells, but not of CRH-negative cells, increased with stressor intensity regardless of the type of stressor. The response magnitude of responsive down cells was unaffected by stressor intensity. The data are presented as the means ± SEM; asterisks indicate significant differences at p < 0.05 and p < 0.01. D, The stimulus-induced change in amplitude of the fluorescence signal (left) and the change in the area under the curve of the peaks (peak AUC; right) increased with stressor intensity regardless of the type of stressor applied. The data are presented as the mean ± SEM; asterisks indicate significant differences at p < 0.05, p < 0.01 or p < 0.001. nr., Number; resp., responsive.
Figure 5.
Figure 5.
Neuronal responses within the NPO are highly synchronized. A, A typical imaging field of view showing the red-labeled CRH-positive cells among other NPO cells (in green). B, Fluorescence signals of the two cells marked in A. Although the cells were located in different hemispheres, they showed remarkable synchronicity after stimulus onset. C, The onset of Ca2+ events is shown as ticks for CRH-positive cells in three representative larvae per condition (time is on the x-axis, cell ID is on the y-axis). Within each animal, Ca2+ events in CRH-positive cells were largely simultaneous. D, Cross-correlation histograms showing the means ± SEMs of all pairs of cells (within a single animal), excluding inactive cells. The histograms reveal a peak at 0 s, consistent with synchronicity among CRH-positive cells. The peak at 0 s in the cross-correlation histograms for CRH-negative cells within the NPO also indicates synchronicity among this group of cells. Means ± SEMs are shown as lines and shaded backgrounds. Sample sizes: CRH-positive NaCllow, 10 animals in total (4 animals with 2 cells, 3 animals with 3 cells, 1 animal with 4 cells, 1 animal with 5 cells, 1 animal with 6 cells), resulting in 43 cross-correlations; CRH-positive NaClhigh, 12 animals in total (6 animals with 2 cells, 3 animals with 3 cells, 2 animals with 4 cells, 1 animal with 5 cells), resulting in 38 cross-correlations; CRH-positive HCllow, 9 animals in total (2 animals with 2 cells, 4 animals with 3 cells, 2 animals with 4 cells, 1 animal with 6 cells), resulting in 41 cross-correlations; CRH-positive HClhigh, 10 animals in total (1 animal with 2 cells, 2 animals with 3 cells, 2 animals with 4 cells, 3 animals with 5 cells, 2 animals with 7 cells), resulting in 91 cross-correlations; CRH-negative NaCllow, 3 animals in total (each with 2 cells), resulting in 3 cross-correlations; CRH-negative NaClhigh, 5 animals in total (2 animals with 2 cells, 2 animals with 3 cells, 1 animal with 5 cells), resulting in 18 cross-correlations; CRH-negative HCllow, 5 animals in total (2 animals with 2 cells and 3 animals with 3 cells), resulting in 11 cross-correlations; CRH-negative HClhigh, 7 animals in total (4 animals with 2 cells and 3 animals with 3 cells), resulting in 13 cross-correlations.
Figure 6.
Figure 6.
CRH cell activities are synchronized within and across hemispheres. Cross-correlation analysis of CRH-positive cells in three representative larvae within the left hemisphere (green), the right hemisphere (dark blue), or across hemispheres (maroon) shows that responses were synchronized within and across hemispheres. Note that for larva 1 and 3, synchronicity in the left hemisphere was weaker than in the right hemisphere and across hemispheres, whereas for larva 2 synchronicity in the right hemisphere was weaker than in the left hemisphere and across hemispheres. Average cross-correlation histograms of CRH cell activity 100 s poststimulus, including SEMs (gray bands), are shown. (Larva 1: ntotal = 7 cells; nleft = 3 cells, 3 cross-correlations; nright = 4 cells, 6 cross-correlations; nleft-right = 7 cells, 12 cross-correlations; Larva 2: ntotal = 7 cells; nleft = 3 cells, 3 cross-correlations; nright = 4 cells, 6 cross-correlations; nleft-right = 7 cells, 12 cross-correlations; Larva 3: ntotal = 6 cells; nleft = 3 cells, 3 cross-correlations; nright = 3 cells, 3 cross-correlations; nleft-right = 6 cells, 9 cross-correlations). hemi., Hemisphere.
Figure 7.
Figure 7.
Mechanism by which hypothalamic CRH cells respond to different intensities of stress. Schematic representation of the mechanism by which CRH-positive cells (red) encode the severity of a threat: a stressor strength-dependent neuronal output is achieved by a dual mechanism involving changes in the activity of individual CRH cells and variations in the pool of responsive cells that participate in the response, whereby increased stress leads to increased CRH cell activity and the recruitment of a larger pool of responsive cells.

References

    1. Alderman SL, Bernier NJ. Ontogeny of the corticotropin-releasing factor system in zebrafish. Gen Comp Endocrinol. 2009;164:61–69. doi: 10.1016/j.ygcen.2009.04.007. - DOI - PubMed
    1. Alon T, Zhou L, Pérez CA, Garfield AS, Friedman JM, Heisler LK. Transgenic mice expressing green fluorescent protein under the control of the corticotropin-releasing hormone promoter. Endocrinology. 2009;150:5626–5632. doi: 10.1210/en.2009-0881. - DOI - PMC - PubMed
    1. Andrew RD, MacVicar BA, Dudek FE, Hatton GI. Dye transfer through gap junctions between neuroendocrine cells of rat hypothalamus. Science. 1981;211:1187–1189. doi: 10.1126/science.7466393. - DOI - PubMed
    1. Belchetz PE, Plant TM, Nakai Y, Keogh EJ, Knobil E. Hypophysial responses to continuous and intermittent delivery of hypopthalamic gonadotropin-releasing hormone. Science. 1978;202:631–633. doi: 10.1126/science.100883. - DOI - PubMed
    1. Belin V, Moos F. Paired recordings from supraoptic and paraventricular oxytocin cells in suckled rats: recruitment and synchronization. J Physiol. 1986;377:369–390. doi: 10.1113/jphysiol.1986.sp016192. - DOI - PMC - PubMed

Publication types

MeSH terms

LinkOut - more resources