

Health Disparities in Drug- and Alcohol-Use Disorders: A 12-Year Longitudinal Study of Youths After Detention
- PMID: 26985602
- PMCID: PMC4985078
- DOI: 10.2105/AJPH.2015.303032
Health Disparities in Drug- and Alcohol-Use Disorders: A 12-Year Longitudinal Study of Youths After Detention
Abstract
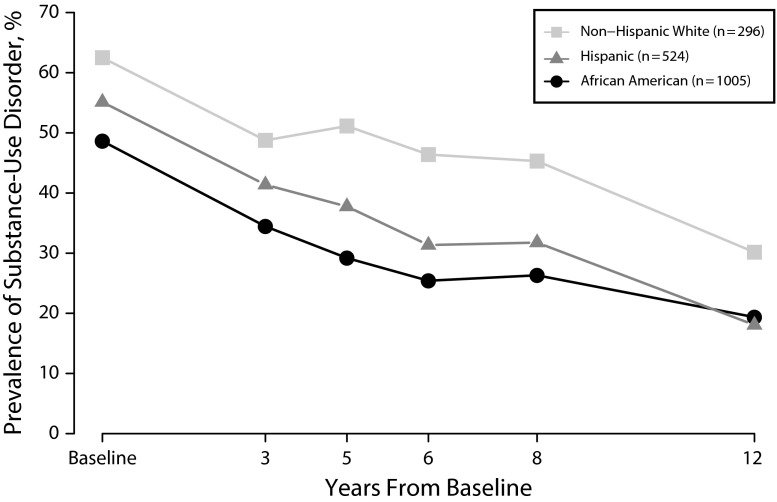
Objectives: To examine sex and racial/ethnic differences in the prevalence of 9 substance-use disorders (SUDs)--alcohol, marijuana, cocaine, hallucinogen or PCP, opiate, amphetamine, inhalant, sedative, and unspecified drug--in youths during the 12 years after detention.
Methods: We used data from the Northwestern Juvenile Project, a prospective longitudinal study of 1829 youths randomly sampled from detention in Chicago, Illinois, starting in 1995 and reinterviewed up to 9 times in the community or correctional facilities through 2011. Independent interviewers assessed SUDs with Diagnostic Interview Schedule for Children 2.3 (baseline) and Diagnostic Interview Schedule version IV (follow-ups).
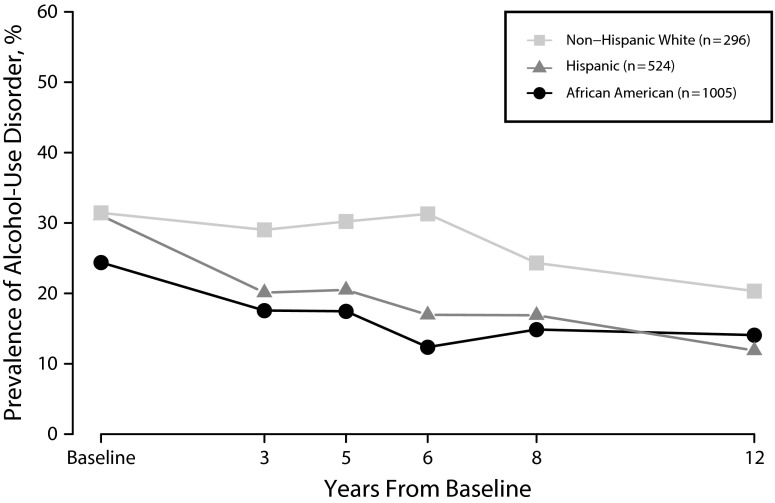
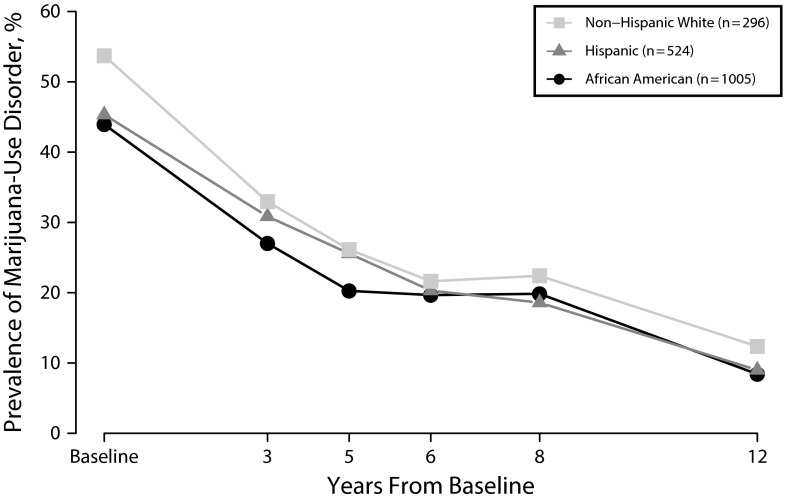
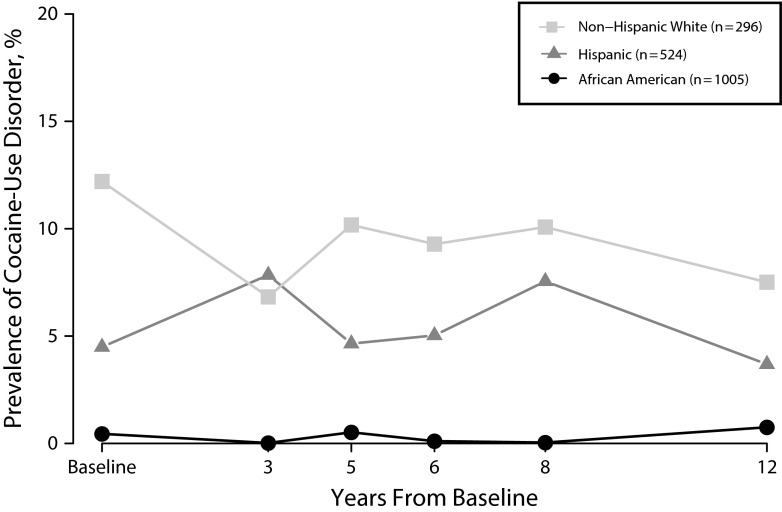
Results: By median age 28 years, 91.3% of males and 78.5% of females had ever had an SUD. At most follow-ups, males had greater odds of alcohol- and marijuana-use disorders. Drug-use disorders were most prevalent among non-Hispanic Whites, followed by Hispanics, then African Americans (e.g., compared with African Americans, non-Hispanic Whites had 32.1 times the odds of cocaine-use disorder [95% confidence interval = 13.8, 74.7]).
Conclusions: After detention, SUDs differed markedly by sex, race/ethnicity, and substance abused, and, contrary to stereotypes, did not disproportionately affect African Americans. Services to treat substance abuse--during incarceration and after release--would reach many people in need, and address health disparities in a highly vulnerable population.
Figures
Comment in
-
"Falling Through the Cracks:" Young Adults, Drugs, and Incarceration.Am J Public Health. 2016 Jun;106(6):972-3. doi: 10.2105/AJPH.2016.303214. Am J Public Health. 2016. PMID: 27153010 Free PMC article. No abstract available.
References
-
- Bonczar TP. Washington, DC: US Department of Justice; 2003. Prevalence of imprisonment in the U.S. population, 1974–2001. Bureau of Justice Statistics Special Report.
-
- James DJ. Profile of jail inmates, 2002. Washington, DC: US Department of Justice; 2004. NCJ 201932.
-
- Sickmund M, Sladky A, Kang W. Washington, DC: Office of Juvenile Justice and Delinquency Prevention; 2014. Easy access to juvenile court statistics: 1985–2011.
-
- Bureau of Justice Statistics. Federal criminal case processing statistics. 2013. Available at: http://www.bjs.gov/fjsrc/var.cfm?ttype=one_variable&agency=BOP&db_type=P.... Accessed August 8, 2014.
-
- Stephan J, Walsh G. Census of jail facilities, 2006. Washington, DC: Bureau of Justice Statistics; 2011.
Publication types
MeSH terms
Grants and funding
LinkOut - more resources
Full Text Sources
Other Literature Sources
Medical
