

Disability-Free Life Expectancy Over 30 Years: A Growing Female Disadvantage in the US Population
- PMID: 26985619
- PMCID: PMC4860065
- DOI: 10.2105/AJPH.2016.303089
Disability-Free Life Expectancy Over 30 Years: A Growing Female Disadvantage in the US Population
Abstract
Objectives: To examine changes in active life expectancy in the United States over 30 years for older men and women (aged ≥ 65 years).
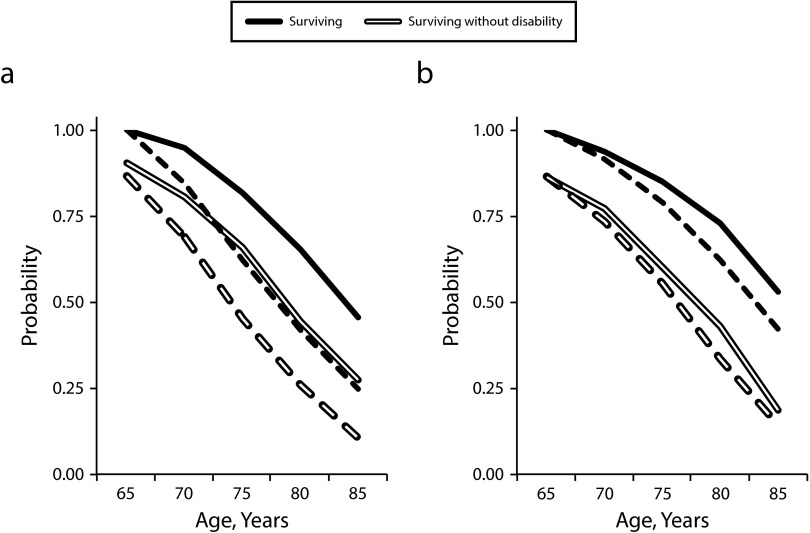
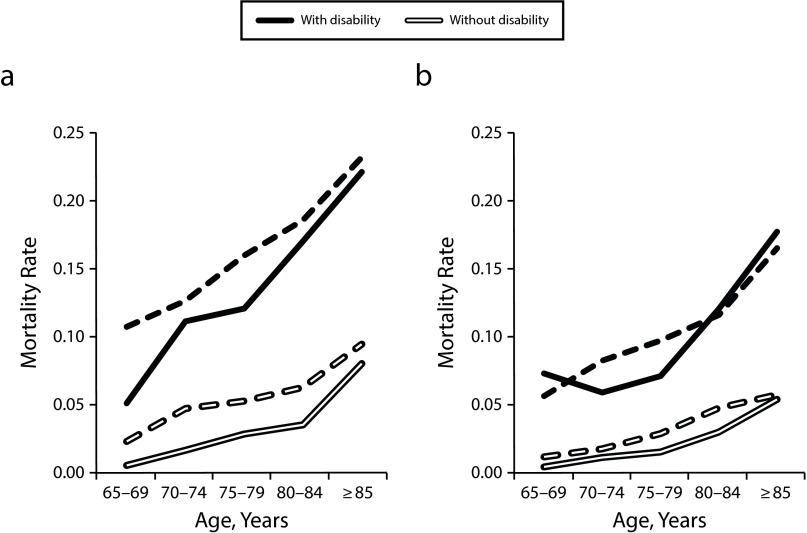
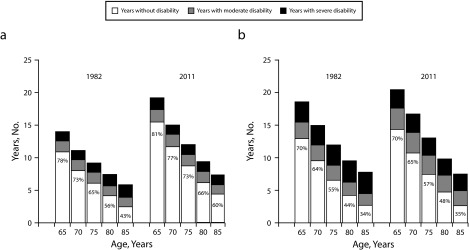
Methods: We used the 1982 and 2004 National Long Term Care Survey and the 2011 National Health and Aging Trends Study to estimate age-specific mortality and disability rates, the overall chances of survival and of surviving without disability, and years of active life for men and women.
Results: For older men, longevity has increased, disability has been postponed to older ages, disability prevalence has fallen, and the percentage of remaining life spent active has increased. However, for older women, small longevity increases have been accompanied by even smaller postponements in disability, a reversal of a downward trend in moderate disability, and stagnation of active life as a percentage of life expectancy. As a consequence, older women no longer live more active years than men, despite their longer lives.
Conclusions: Neither a compression nor expansion of late-life disability is inevitable. Public health measures directed at older women to postpone disability may be needed to offset impending long-term care pressures related to population aging.
Figures
References
-
- Colby SL, Ortman JM. The Baby Boom Cohort in the United States: 2012 to 2060. Current Population Reports. Washington, DC: US Census Bureau; 2014. pp. 25–1141.
-
- Gruenberg EM. The failures of success. Milbank Mem Fund Q Health Soc. 1977;55(1):3–24. - PubMed
-
- Fries JF. Aging, natural death and the compression of morbidity. N Engl J Med. 1980;303(3):130–135. - PubMed
-
- Manton KG. Changing concepts of morbidity and mortality in the elderly population. Milbank Mem Fund Q Health Soc. 1982;60(2):183–244. - PubMed
Publication types
MeSH terms
Grants and funding
LinkOut - more resources
Full Text Sources
Other Literature Sources
Medical
Research Materials
