. 2016 Mar 16;89(6):1317-1330.
doi: 10.1016/j.neuron.2016.02.020.

A Role for Synaptic Input Distribution in a Dendritic Computation of Motion Direction in the Retina

Affiliations

A Role for Synaptic Input Distribution in a Dendritic Computation of Motion Direction in the Retina

Anna L Vlasits et al. Neuron. .

Abstract

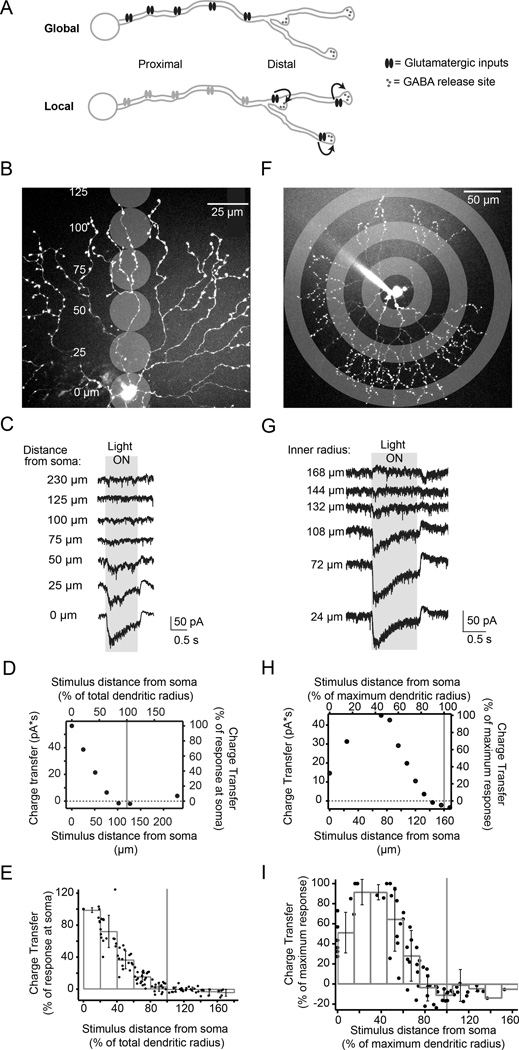
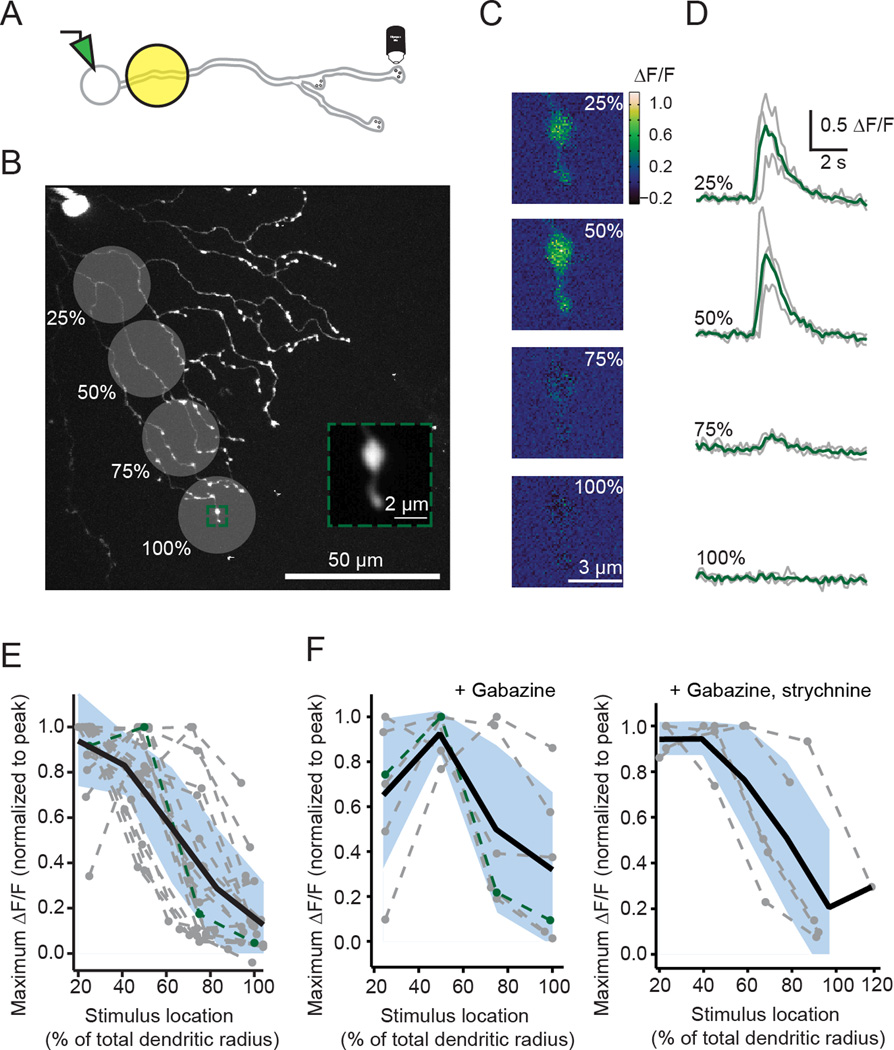
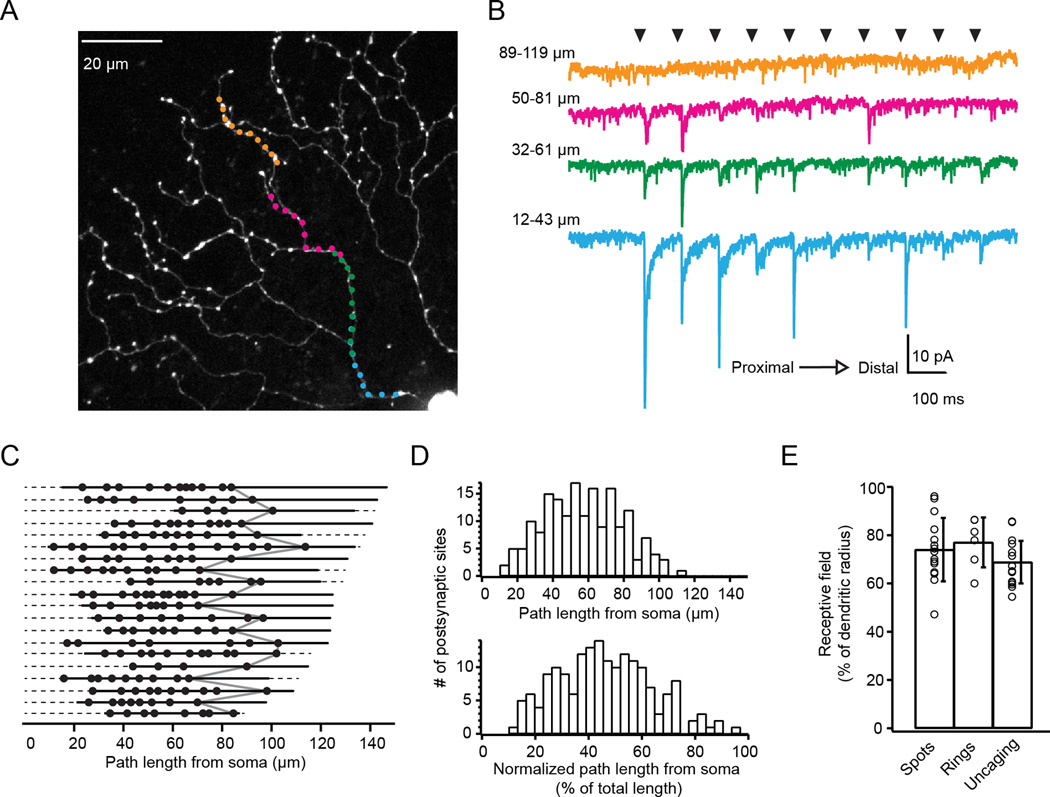
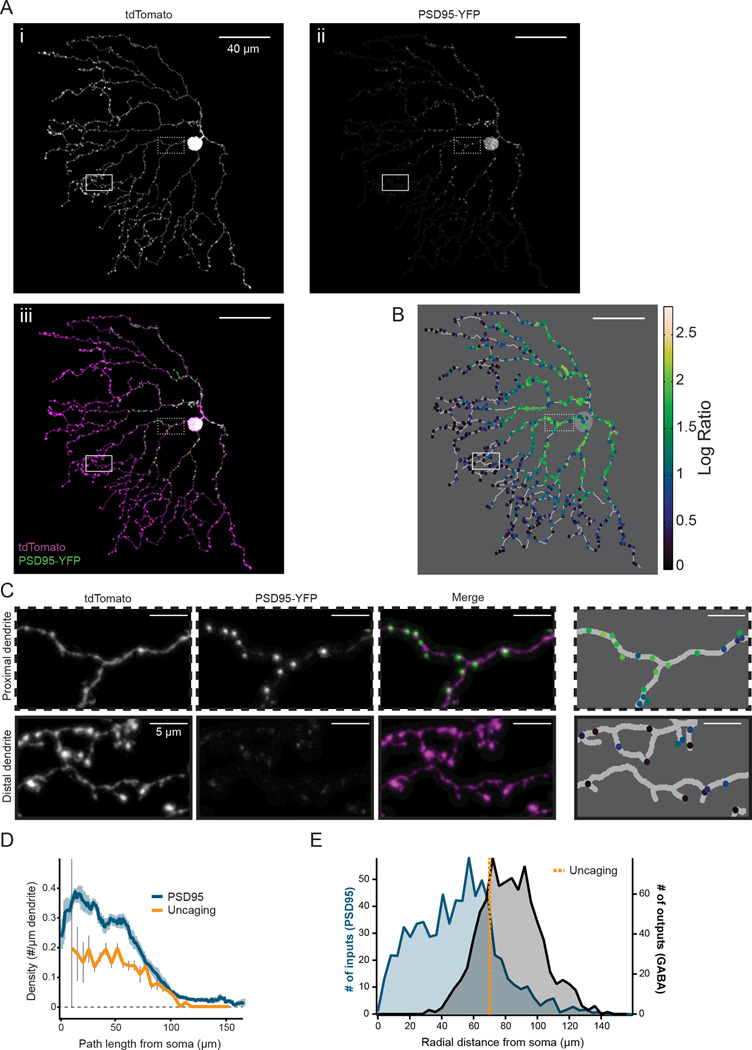
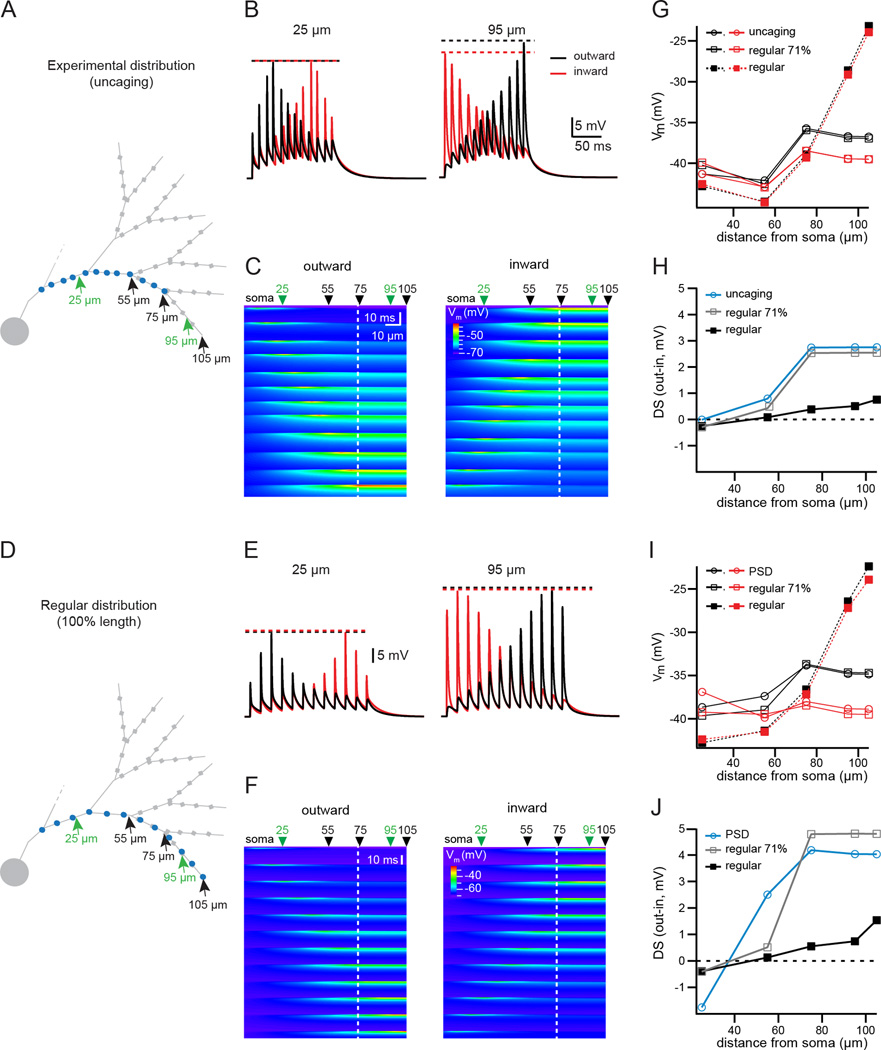
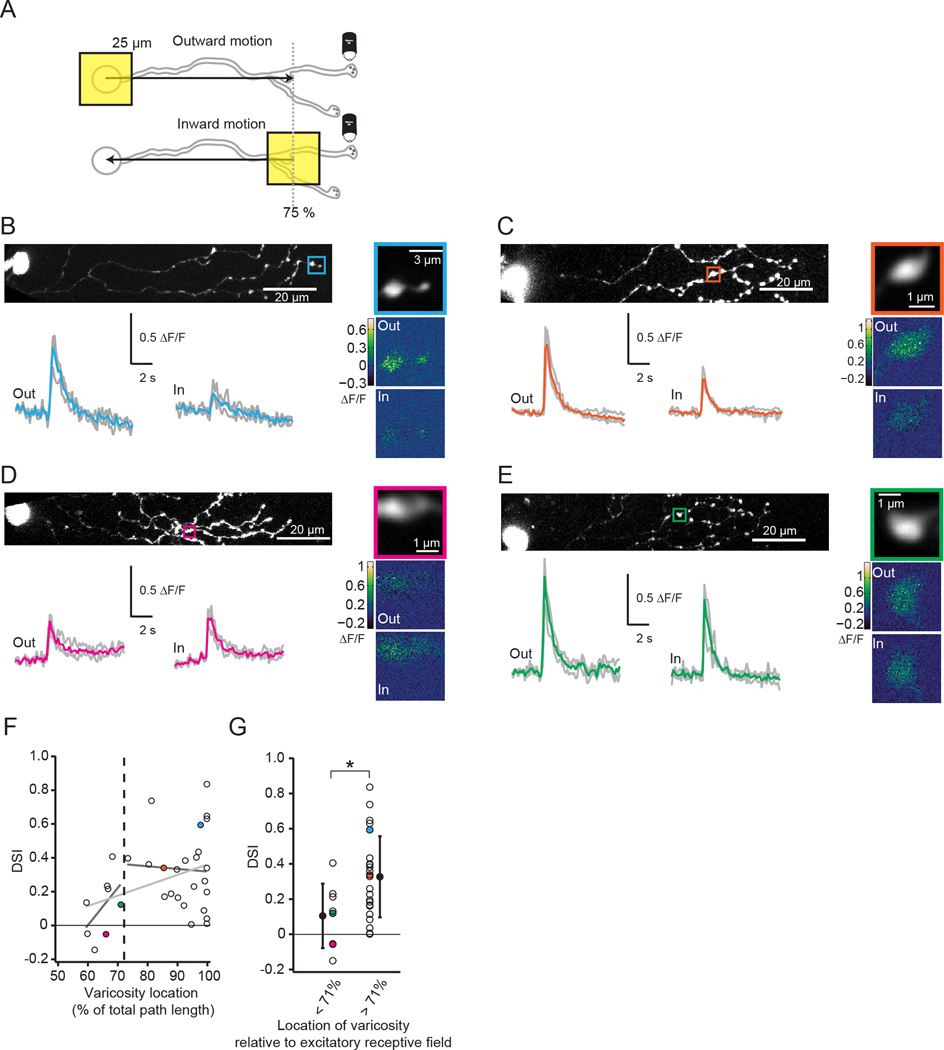
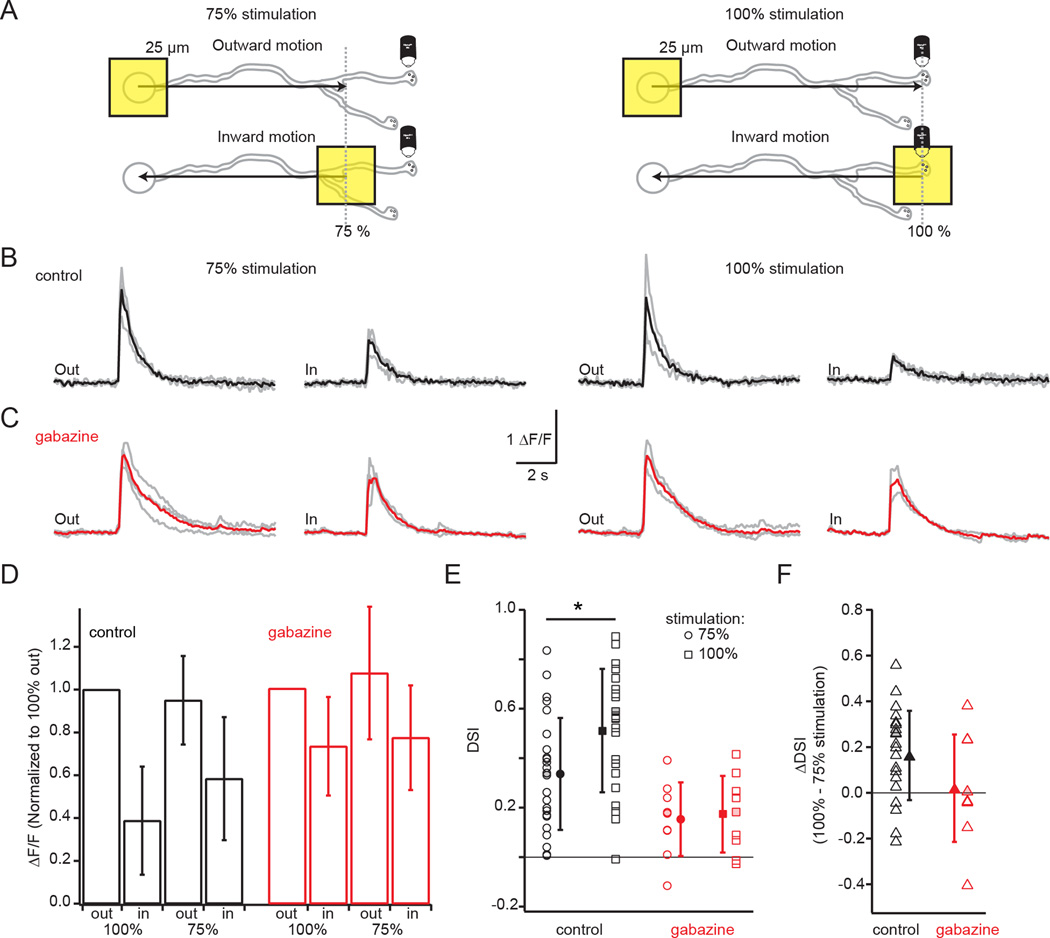
The starburst amacrine cell in the mouse retina presents an opportunity to examine the precise role of sensory input location on neuronal computations. Using visual receptive field mapping, glutamate uncaging, two-photon Ca(2+) imaging, and genetic labeling of putative synapses, we identify a unique arrangement of excitatory inputs and neurotransmitter release sites on starburst amacrine cell dendrites: the excitatory input distribution is skewed away from the release sites. By comparing computational simulations with Ca(2+) transients recorded near release sites, we show that this anatomical arrangement of inputs and outputs supports a dendritic mechanism for computing motion direction. Direction-selective Ca(2+) transients persist in the presence of a GABA-A receptor antagonist, though the directional tuning is reduced. These results indicate a synergistic interaction between dendritic and circuit mechanisms for generating direction selectivity in the starburst amacrine cell.


Figures

Figure 1
Figure 1. Starburst amacrine cell excitatory receptive field is smaller than dendritic field
A) Schematic of two distributions of glutamatergic inputs (ovals) and GABAergic release sites (outputs, small circles) on a SAC dendrite. The skewed distribution (top) produces a global computation where all inputs contribute, while the regular distribution produces primarily local computations, with receptors near outputs having a dominant effect on neurotransmitter release (arrows). B) Schematic showing locations of visual stimulation spots overlaid on a 2-photon fluorescence image of a SAC (z-projection). Distances are relative to the soma. C) Light-evoked current responses for illumination locations shown in B (holding potential = −72 mV). Grey box indicates the timing of the stimulus onset and offset. Traces are averages of 4 sweeps. D) Excitatory charge transfer as a function of distance from experiment in C. Right and top axes are normalized to the maximum charge transfer and maximum dendritic radius, respectively. Grey vertical line: the radius of the dendritic tree. E) Normalized excitatory charge transfer following visual stimulation as a function of distance from the soma (15 cells). Black dots: individual cells; grey bars: binned averages. Grey vertical line: 100% of the radius of the dendritic tree. Error bars = S.D. F) Schematic showing anatomical location of visual stimulation rings overlaid with 2-photon fluorescence projection of a SAC at low magnification. Rings shown have an inner radius of 24, 72, and 132 µm. The thickness of the rings was 24 µm. G) Voltage clamp recordings (holding potential = −72 mV) from the SAC in F during stimulation with stationary rings (width = 24 µm) with different inner radii. Averages of 4 sweeps. Grey box: the timing of the stimulus onset and offset. H) Excitatory charge transfer calculated from the recordings in G plotted as a function of the inner radius from the soma. Right and top axes are normalized to the maximum charge transfer and maximum dendritic radius, respectively. For this cell, the maximum dendritic radius was 160 µm. I) Excitatory charge transfer calculated for 6 cells plotted as a function of the length of the inner radius from the soma. Axes are normalized to the maximum charge transfer response and maximum dendritic radius, respectively. Black dots: measurements from each cell; grey bars: binned averages of these measurements; error bars: S.D. See also Figure S1.
Figure 2
Figure 2. Ca2+ transients in varicosities are largest during proximal visual stimulation
A) Schematic displaying experiment to image a distal varicosity from a SAC filled with 150 µM OGB-1 during visual stimulation with 25 µm diameter spots. B) Location of visual stimulation spots overlaid with a 2-photon fluorescence image of a SAC filled with OGB-1 (z-projection). Visual stimuli were centered at indicated positions (25, 50, 75, 100%) after measuring the SAC dendritic radius along the axis of the varicosity being imaged. Green box: ROI used to image a distal varicosity. The soma and patch electrode are visible in the top left corner. Inset: average intensity projection of the fluorescent images acquired during visual stimulation. C) Maximal change in fluorescence (ΔF/F) responses of the ROI shown in B to one presentation of each spot located at the indicated % of the total dendritic radius along the axis of the varicosity being imaged. D) ΔF/F (grey lines) following visual stimulation centered at the % of the total dendritic radius for the varicosity in B. Green traces: the mean of three trials. E) Maximum ΔF/F normalized to the peak response for 15 varicosities measured from 15 cells in response to stimuli at four locations along their dendrites (grey dotted lines; green line = the cell in B–D). Black line: the average response of linear interpolations of each receptive field. Blue shading = S.D. F) Same as E but for varicosities in the presence of 5 µM gabazine (left; 5 cells) or 5 µM gabazine + 1 µM strychnine (right; 5 cells) to isolate the excitatory inputs.
Figure 3
Figure 3. Glutamate receptors are absent from distal dendrites
A) 2-photon fluorescence image of a SAC (z-projection) with targeted locations of glutamate uncaging sites along one dendritic path. Colors correspond to current responses in B. B) Voltage clamp recordings (holding potential = −72 mV) from the cell in A in response to glutamate uncaging at 40 dendritic sites. Black arrowheads indicate the timing of the 100 µs laser uncaging pulses at different dendritic sites (moving outward from the soma to the distal dendrites from left to right and bottom to top). Traces are averages of 10 sweeps. C) Locations where uncaging-evoked EPSCs indicated the presence of putative postsynaptic sites (black dots). Each row represents a different dendrite (n = 20 dendrites from 15 cells). Dashed lines: the entire path lengths from the soma to the end of the dendrite; solid lines: the path lengths sampled by uncaging. Locations of the last synapses in each dendrite are connected by the grey line. D) Histograms of the putative postsynaptic sites as a function of path length (top) or path length normalized to the dendritic length of each dendrite. E) Starburst amacrine cell excitatory receptive field size determined using spot stimulation (‘Spots’), ring stimulation (‘Rings’), or glutamate uncaging (‘Uncaging’). Error bars are S.D. See also Figures S2–3.
Figure 4
Figure 4. Distribution of putative postsynaptic sites is skewed away from output sites
A) Projection image of the analyzed dendritic processes of a SAC expressing tdTomato (i) and PSD95-YFP (ii). iii is a merged image showing tdTomato in magenta and PSD95-YFP in green; in this image, contrast was adjusted to improve visibility for display. The image was masked to exclude dendritic branches that overlapped with other labeled cells to ensure that only PSD95 puncta from SACs were included in analysis. Magnified regions (dotted and solid boxes) correspond to example proximal and distal regions in C. B) Skeleton of cell from A with identified PSD95 puncta (colored dots). Colors represent the log ratio of the PSD95 to tdTomato fluorescence intensity within each puncta, which was used for thresholding puncta to include in subsequent analysis (see Methods). C) Examples of proximal (top) and distal (bottom) regions indicated by the dotted and solid boxes in A. Colors of identified puncta in the 4th column correspond to the heat map in B. D) Density of PSD95-YFP puncta or putative postsynaptic sites determined by uncaging (see Fig. 3E) as a function of dendritic path length from the soma. For PSD95, the average linear density of PSD95 puncta using a 10 µm sliding window is plotted using a threshold log ratio of 1.0 to select puncta to include (blue line; light blue shading = S.E.M, 8 cells). For uncaging, histogram of the average density of putative postsynaptic sites in 5 µm bins is plotted (orange line; grey bars = S.E.M, 23 dendrites). E) Histogram of PSD95 puncta from 8 SACs using a threshold log ratio of 1.0 (left axis, blue) as well as the synaptic contacts with DSGCs (outputs, right axis, black) as a function of radial distance from the soma. Orange dotted line: the mean radial distance of the last putative postsynaptic sites detected with uncaging (see Fig. 3E). Outputs were determined from electron microscopy reconstructions of 24 SACs (Briggman et al., 2011) and analyzed as a function of radial distance to compare with PSD95 locations. See also Figure S4.
Figure 5
Figure 5. Synaptic input distribution supports DS of simulated dendritic voltage
A) Ball-and-stick representation of a partial SAC dendritic tree, used for simulations of dendritic integration in a passive model. Blue circles: the location of synapses used in simulations, corresponding to the average location of putative synapses determined from uncaging. Green arrows: locations where the dendritic voltage is plotted in B; black arrows: locations where the peak of the dendritic voltage is plotted in the summary in G–H. Grey squares: wider compartments of the distal dendrite representing varicosities. B) Simulated dendritic voltage at two locations (indicated by green arrows in A), in response to the outward (black traces) or inward (red traces) activation of the synapses displayed in A at a speed of 500 µm/s. Dotted lines: amplitude of the peak of the synaptic response in each condition. C) Heat map of simulated dendritic voltage measured along the entire dendritic branch containing the activated synapses (x-axis) for the duration of the stimulus (y-axis). The color scale depicts the peak amplitude of the depolarization. Left plot: response to outward stimulation. Right plot: response to inward stimulation. At the peak of the activation of each synapse, the local voltage propagates with little electrotonic attenuation to the dendritic tip due to the end effect of the electrical cable. Green arrows: the two positions along the dendrite corresponding to the traces in B (25 and 95 µm from the soma); black arrows: locations where the peak of the dendritic voltage is plotted in the summary in G–H. The white dotted line indicates the location of the most distal synapse. D) Same as A, but blue circles indicate the location of regularly distributed synapses, the most distal synapse being located at the tip of the dendrite. For the regular distributions, the average density is the same as the experimental distribution determined with uncaging (0.09/µm). E) Same as B, for the gradient of regular synapses stopping at 100% of the dendritic length (displayed in D). F) Same as C, for the gradient of regular synapses stopping at 100% of the dendritic length (displayed in D). G) Plot of the maximum simulated dendritic voltage during inward (red) or outward (black) activation of synapses, measured at several dendritic locations, for the experimental distribution of synapses (circles, solid lines), a distribution of regularly spaced synapses with the most distal synapse located at 71% of the length of the dendrite as in the experimental distribution (open squares, solid lines), and the regular distribution stopping at the tip of the dendrite (closed squares, dotted lines). H) Summary plot showing the DS (defined as the difference of the peak dendritic voltage measured during outward and inward activation of inputs) at various dendritic locations for the different synaptic distributions (experimental distribution of synapses, circles, light blue; regularly spaced synapses with the most distal synapse located at 71% of the dendritic length, open squares, grey; regular distribution stopping at the tip of the dendrite, closed squared, black). I) Same as G, using synapse gradients determined from the average locations of PSD95 labeling (see Fig. S5). The regular distributions in this plot have the same average synaptic density as the experimental distribution from PSD95 labeling (0.2/µm). J) Same as H, using synapse gradients determined from the average locations of putative PSDs. See also Figure S5.
Figure 6
Figure 6. DS of varicosities depends on varicosity location
A) Schematic showing imaging of a distal varicosity from an OGB-1-filled SAC presented with a 25 µm square of light moving either outward from the soma toward the distal dendrites or inward from the distal dendrites toward the soma. The stimulus was restricted to 75% of the dendritic radius (grey dotted line). B–E Four examples of Ca2+ responses to stimulation with moving squares. B is an example of an outward-preferring varicosity near the end of the dendrite. C is an example of a more proximal varicosity that is strongly direction selective for outward motion. D is an example of a slightly inward-preferring varicosity. E is an example of an untuned varicosity. Top left: 2-photon fluorescence image of SAC filled with OGB-1 (z-projection). The square indicates the imaged varicosity. The soma is on the left. Top right: Average intensity projection of the imaged varicosity during the entire experiment. Bottom left: ΔF/F (grey) following visual stimulation with a 25 µm moving square either outward from the soma toward the end of the dendrites (“out”) or inward from the distal dendrites toward the soma (“in”). Colored traces: averages of the three trials. Bottom right: Maximal ΔF/F responses of the imaged varicosities to a single presentation of the moving square moving outward (“out”) or inward (“in”) along the dendritic radius. F) Direction selective index (DSI) for varicosities from 33 cells in response to inward vs. outward moving squares (black circles) as a function of the varicosity location normalized to the path length of the dendrite. A positive value for the DSI indicates a larger response for outward motion compared to inward motion. Colored dots are the DSIs for the example cells in B–E. Black dotted line: average length of the excitatory receptive field predicted from uncaging (see Fig. 3). Light grey line is a linear fit to the entire data set (slope = 0.006, r2 = 0.134) while dark grey lines are fits to the varicosities inside vs. outside of the receptive field detected from uncaging (inside: slope = 0.022, r2=0.248; outside: slope = −0.002, r2 = 0.002). G) DSI for varicosities from 33 cells (black circles) sorted by whether they are within (< 71%; 8 cells) or outside (> 71%; 25 cells) of the mean excitatory receptive field predicted from uncaging (black dotted line in F). Colored dots are the DSIs for the example cells in B–E. Open circles = means ;error bars = S.D. * = p < 0.05, Student’s t-test. See also Figure S6.
Figure 7
Figure 7. GABAergic lateral inhibition enhances DS
A) Schematic showing imaging of a distal varicosity from an OGB-1-filled SAC presented with a 25 µm square of light moving either outward from the soma toward the distal dendrites or inward from the distal dendrites toward the soma. Left: Visual stimulation restricted to 75% of the dendritic radius (grey dotted line), which activated less of the lateral inhibition from neighboring SACs. Right: Visual stimulation of 100% of the dendritic radius (grey dotted line), which activated more of the lateral inhibition. B) Ca2+ responses (ΔF/F, grey) from a single varicosity following visual stimulation with a 25 µm moving square either outward from the soma toward the end of the dendrites (“out”) or inward from the distal dendrites toward the soma (“in”) in response to either the 75% stimulation (left traces) or the 100% stimulation (right traces) depicted in A. Black traces: averages of three trials. C) Same as B but showing the responses of a different varicosity from a different cell in the presence of 5 µm gabazine to block GABAa receptors. Red traces: averages of the three trials. D) The average maximum ΔF/F for varicosities in control conditions (black bars) in response to 100% (23 cells) or 75% (26 cells) outward and inward stimulation normalized to the response to 100% outward stimulation and in 5 µm gabazine (red, 9 cells for both 75% and 100% stimulation). The control and gabazine populations are separate. Error bars = S.D. E) Direction selective index (DSI) for the varicosities in D in response to 75% stimulation (circles) or 100% stimulation (squares) in control conditions (black) or 5 µM gabazine (red). Solid symbols = mean; error bars = S.D. * = paired t-test: p<0.05, n=22 varicosities for which both 75% and 100% stimulation was measured. Shaded-in symbols: example cells in B and C. F) The ΔDSI showing the difference between the DSI in response to 100% vs 75% stimulation in varicosities in control conditions (black triangles, 22 cells) and in 5 µm gabazine (red triangles, 9 cells). Solid triangles: means; error bars = S.D. Shaded-in symbols: example cells in B and C. See also Figure S7.

References

    1. Abrahamsson T, Cathala L, Matsui K, Shigemoto R, Digregorio DA. Thin dendrites of cerebellar interneurons confer sublinear synaptic integration and a gradient of short-term plasticity. Neuron. 2012;73:1159–1172. - PubMed
    1. Amthor FR, Keyser KT, Dmitrieva NA. Effects of the destruction of starburst-cholinergic amacrine cells by the toxin AF64A on rabbit retinal directional selectivity. Vis. Neurosci. 2002;19:495–509. - PubMed
    1. Beier KT, Borghuis BG, El-Danaf RN, Huberman a. D, Demb JB, Cepko CL. Transsynaptic Tracing with Vesicular Stomatitis Virus Reveals Novel Retinal Circuitry. J. Neurosci. 2013;33:35–51. - PMC - PubMed
    1. Berntson A, Taylor WR. Response characteristics and receptive field widths of on-bipolar cells in the mouse retina. J. Physiol. 2000;524:879–889. - PMC - PubMed
    1. Briggman KL, Helmstaedter M, Denk W. Wiring specificity in the direction-selectivity circuit of the retina. Nature. 2011;471:183–188. - PubMed

Publication types

MeSH terms