. 2016 Mar 29;7(13):15315-28.
doi: 10.18632/oncotarget.8100.

Multiple genetic imaging study of the association between cholesterol metabolism and brain functional alterations in individuals with risk factors for Alzheimer's disease

Affiliations

Multiple genetic imaging study of the association between cholesterol metabolism and brain functional alterations in individuals with risk factors for Alzheimer's disease

Feng Bai et al. Oncotarget. .

Abstract

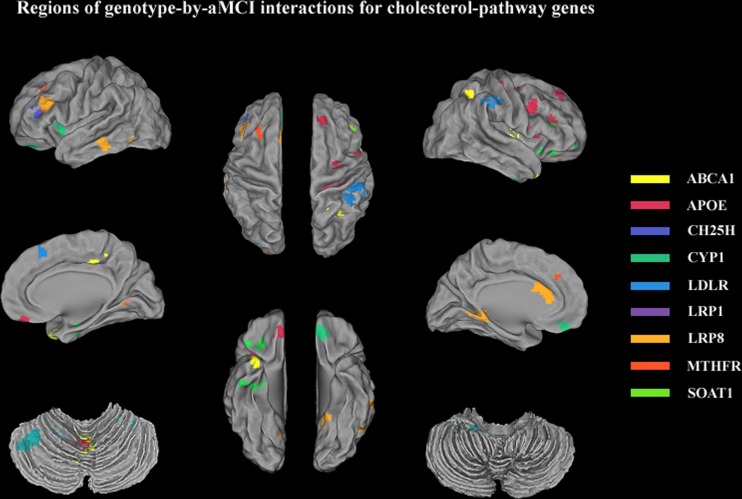
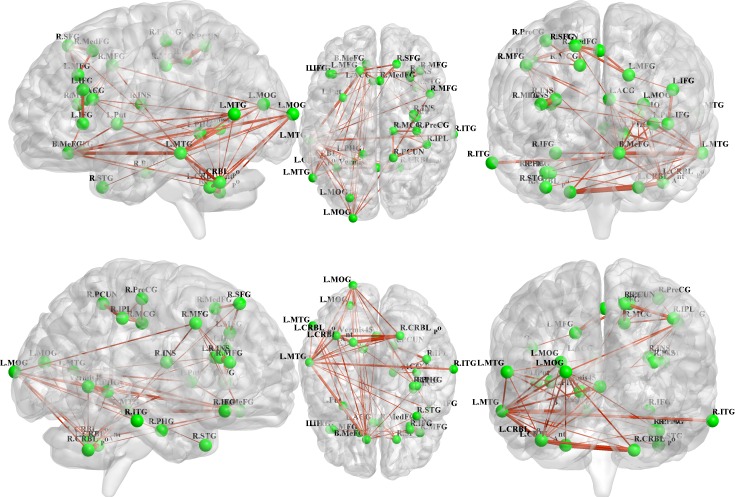
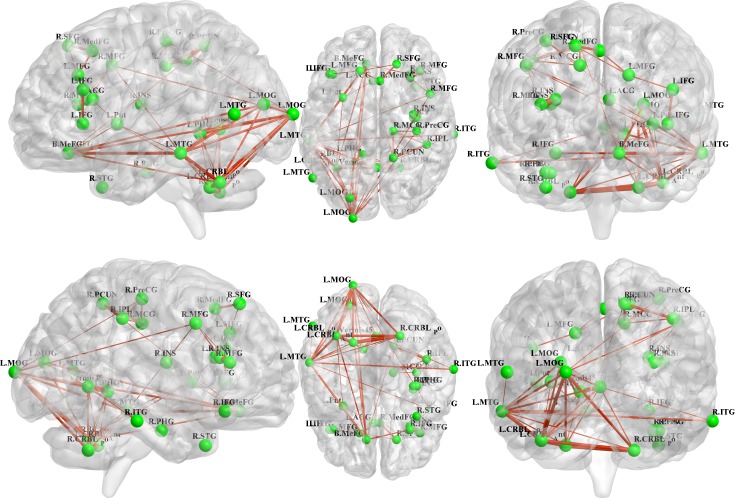
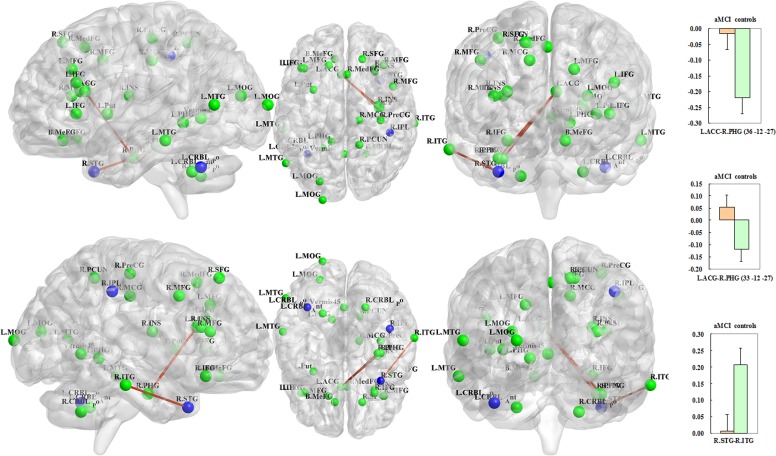
Alzheimer's disease (AD) is a clinically and genetically heterogeneous neurodegenerative disease. Genes involved in cholesterol metabolism may play a role in the pathological changes of AD. However, the imaging genetics-based endophenotypes derived from polymorphisms in multiple functionally related genes are unclear in individuals with risk factors for AD. Forty-three amnestic mild cognitive impairment (aMCI) subjects and 30 healthy controls underwent resting-state functional magnetic resonance imaging (fMRI) measurements of brain topological organization. Thirty-three previously suggested tagging single nucleotide polymorphisms (SNPs) from 12 candidate genes in the cholesterol metabolism pathway were further investigated. A cholesterol metabolism pathway gene-based imaging genetics approach was then utilized to investigate disease-related differences between the groups based on genotype-by-aMCI interactions. The cholesterol metabolism pathway genes exerted widespread effects on the cortico-subcortical-cerebellar spontaneous brain activity. Meanwhile, left lateralization of global brain connectivity was associated with cholesterol metabolism pathway genes. The APOE rs429358 variation significantly influenced the brain network characteristics, affecting the activation of nodes as well as the connectivity of edges in aMCI subjects.The cholesterol metabolism pathway gene-based imaging genetics approach may provide new opportunities to understand the mechanisms underlying AD and suggested that APOE rs429358 is a core genetic variation that is associated with disease-related differences in brain function.

Keywords: Alzheimer’s disease; Gerotarget; amnestic mild cognitive impairment; brain function; cholesterol metabolism pathway; imaging genetics.


Conflict of interest statement

CONFLICTS OF INTEREST

The authors declare no conflict of interest.

Figures

Figure 1
Figure 1. Regions extracted from genotype-by-aMCI interactions for the cholesterol pathway after correcting for the imaging space for any one SNP [Pcorrected(S) < 0.05]: ABCA1 (rs2230806, yellow); APOE (rs7412, rs429358, rs440446, red); CH25H (rs4417181, dark blue); CYP1 (rs754203, rs7157609, green); LDLR (rs1433099, rs2738444, blue); LRP1 (rs1799986, violet); LRP8 (rs5177, rs3737983, rs3820198, deep yellow); MTHFR (rs1801133, orange); and SOAT1 (rs3753526, grass green)
These regions were predominantly components of cortico-subcortical-cerebellar system and included the frontal cortex (superior/medial/middle/inferior frontal gyrus and anterior cingulate), subcortical structures (parahippocampal gyrus and insula), the temporal cortex (superior/middle/inferior temporal gyrus), the parietal cortex (inferior parietal lobule and precuneus), the occipital cortex (middle occipital gyrus), and the cerebellum (posterior lobe/anterior lobe and vermis).
Figure 2
Figure 2. All 31 regions extracted from the genotype-by-aMCI interactions for the cholesterol pathway, after correcting for imaging space for any one SNP [Pcorrected(S) < 0.05], were used to delineate a unidirectional weighted network with 31 nodes and 465 edges that globally described the network connectivity pattern of the control group
In the present study, three correlation coefficient thresholds (r = 0.3, r = 0.5 and r = 0.7) were tested. This figure shows the network for r = 0.3, while the networks for r = 0.5 and r = 0.7 are shown in the Supplementary Materials (Part III). The figure was created using BrainNet Viewer (http://www.nitrc.org/projects/bnv/).
Figure 3
Figure 3. Unidirectional weighted network with 31 nodes and 465 edges for the aMCI group
This figure shows the network for r = 0.3, while the patterns for r = 0.5 and r = 0.7 are shown in the Supplementary Materials (Part III). The figure was created using BrainNet Viewer (http://www.nitrc.org/projects/bnv/).
Figure 4
Figure 4. The blue regions remained significant after correcting for the imaging space for any one SNP [Pcorrected(S) < 0.05] and across multiple SNPs per gene [Pcorrected(S, G) < 0.05] and included the left cerebellum posterior lobe (APOE rs429358), the right superior temporal gyrus (APOE rs429358) and the right inferior parietal lobule (LDLR rs2738444)
In addition, the three red-brown edges indicate decreased connectivity of the unidirectional weighted network in the aMCI subjects compared to the controls (P < 0.005); these edges included the L.ACC (APOE rs429358)-R.PHG (CYP1 rs754203, MNI: 36 −12 −27); L.ACC (APOE rs429358)-R.PHG (CYP1 rs7157609, MNI: 33 −12 −27); and R.STG (APOE rs429358)-R.ITG (LRP1 rs1799986). The correlation coefficient values are shown in the histograms on the right side. The connectivity patterns for the other thresholds (i.e., P < 0.01, 0.05 and 0.001) are shown in the Supplementary Materials (Part IV). The figure was created using BrainNet Viewer (http://www.nitrc.org/projects/bnv/).
Figure 5
Figure 5. Node strength (i.e., the weighted edges) and their behavioural significance were in the aMCI group
The neuropsychological test scores were converted into z-scores.

References

    1. Karch CM, Cruchaga C, Goate AM. Alzheimer's disease genetics: from the bench to the clinic. Neuron. 2014;83:11–26. - PMC - PubMed
    1. Wollmer MA. Cholesterol-related genes in Alzheimer's disease. Biochim Biophys Acta. 2010;1801:762–773. - PubMed
    1. Shobab LA, Hsiung GY, Feldman HH. Cholesterol in Alzheimer's disease. Lancet Neurol. 2005;4:841–852. - PubMed
    1. Rahman A, Akterin S, Flores-Morales A, Crisby M, Kivipelto M, Schultzberg M, Cedazo-Mínguez A. High cholesterol diet induces tau hyperphosphorylation in apolipoprotein E deficient mice. FEBS Lett. 2005;579:6411–6416. - PubMed
    1. Wood WG, Li L, Müller WE, Eckert GP. Cholesterol as a causative factor in Alzheimer's disease: a debatable hypothesis. J Neurochem. 2014;129:559–572. - PMC - PubMed

MeSH terms