. 2016 Mar 17;11(3):e0149907.
doi: 10.1371/journal.pone.0149907. eCollection 2016.

In Situ Staining and Laser Capture Microdissection of Lymph Node Residing SIV Gag-Specific CD8+ T cells--A Tool to Interrogate a Functional Immune Response Ex Vivo

Affiliations

In Situ Staining and Laser Capture Microdissection of Lymph Node Residing SIV Gag-Specific CD8+ T cells--A Tool to Interrogate a Functional Immune Response Ex Vivo

Annelie Tjernlund et al. PLoS One. .

Abstract

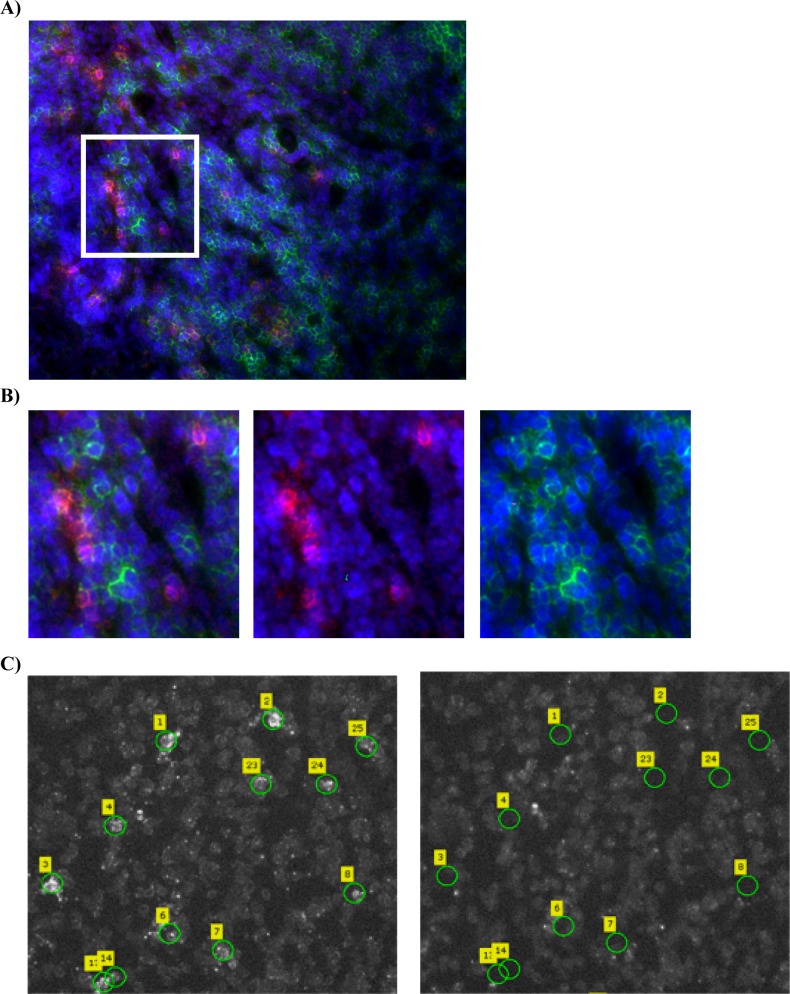
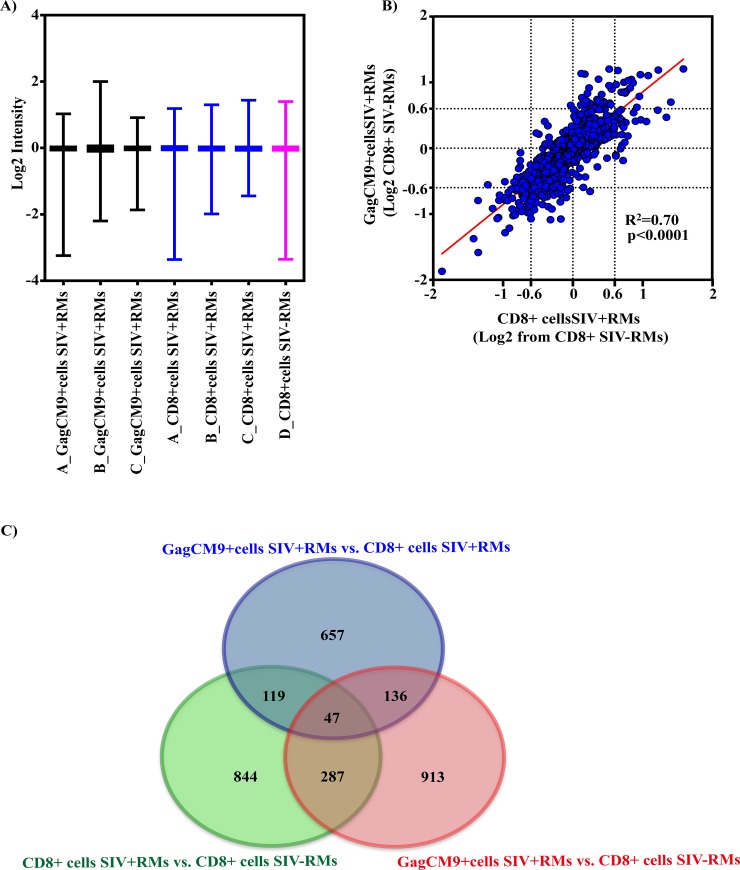
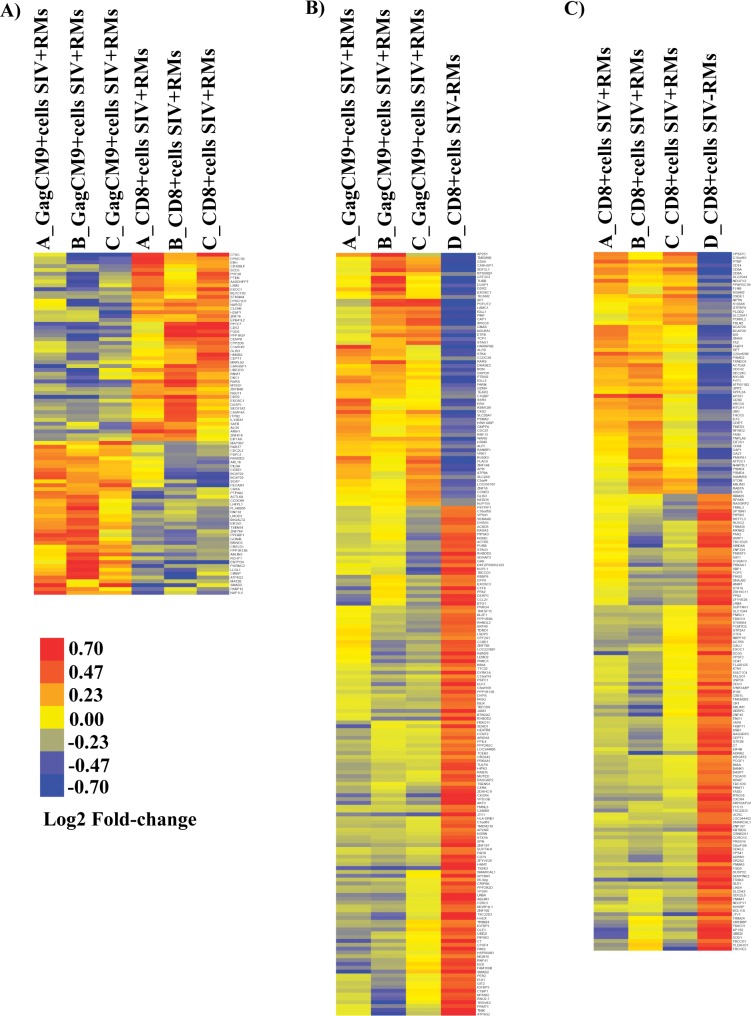
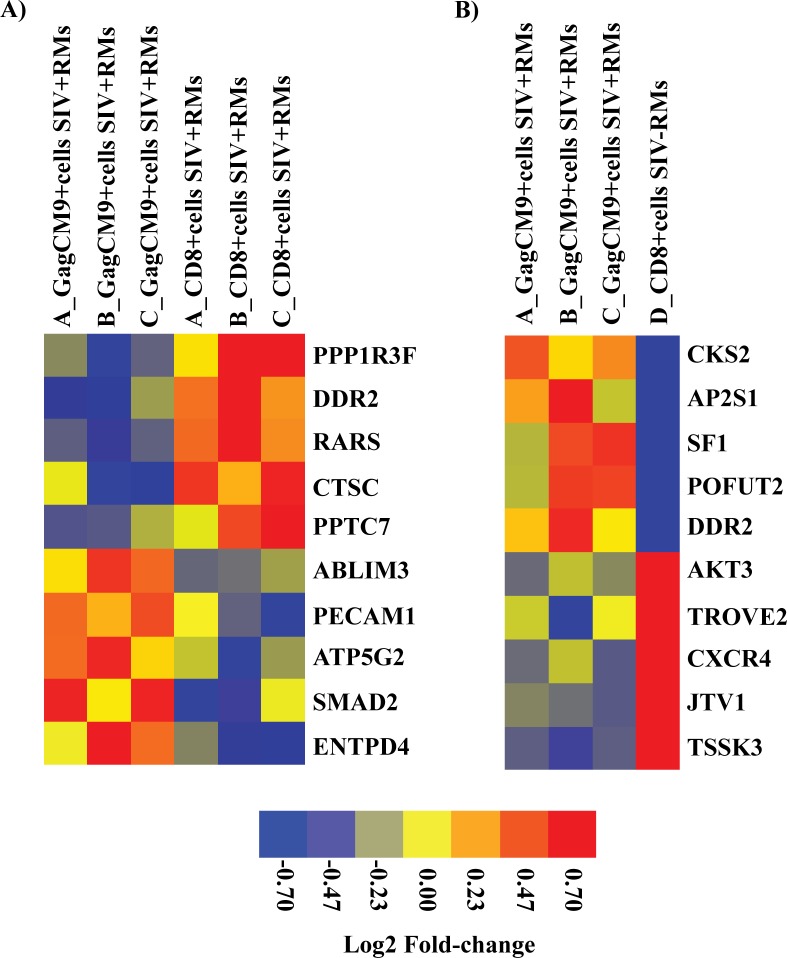
While a plethora of data describes the essential role of systemic CD8+ T cells in the control of SIV replication little is known about the local in situ CD8+ T cell immune responses against SIV at the intact tissue level, due to technical limitations. In situ staining, using GagCM9 Qdot 655 multimers, were here combined with laser capture microdissection to detect and collect SIV Gag CM9 specific CD8+ T cells in lymph node tissue from SIV infected rhesus macaques. CD8+ T cells from SIV infected and uninfected rhesus macaques were also collected and compared to the SIV GagCM9 specific CD8+ T cells. Illumina bead array and transcriptional analyses were used to assess the transcriptional profiles and the three different CD8+ T cell populations displayed unique transcriptional patterns. This pilot study demonstrates that rapid and specific immunostaining combined with laser capture microdissection in concert with transcriptional profiling may be used to elucidate phenotypic differences between CD8+ T cells in SIV infection. Such technologies may be useful to determine differences in functional activities of HIV/SIV specific T cells.


Conflict of interest statement

Competing Interests: The authors have declared that no competing interests exist.

Figures

Fig 1
Fig 1. Laser capture microdissection of GagCM9+cellsSIV+RMs, CD8+cellsSIV+RMs and CD8+cellsSIV-RMs.
A) Fluorescence images of lymph node tissue sections from an SIV infected RM stained with GagCM9 Qdot 655 multimer (red), CD8 (green) and dapi (blue) showing the abundance of GagCM9+ cells. B) A magnified view of the region indicated in panel A, demonstrating that the GagCM9+cellsSIV+RMs cells also express CD8+. C) Images of lymph node tissue sections from an SIV infected RM stained with CM9 Qdot 655 multimer to detect GagCM9+cellsSIV+RMs. The left images show the tissue section with the selected GagCM9+cellsSIV+RMs prior to LCM and the images to the right show the same tissue section after the selected cells have been microdissected and collected.
Fig 2
Fig 2. Comparison of gene expression profiles between GagCM9+cellsSIV+RMs and in CD8+cellsSIV+RMs vs. CD8+cellsSIV-RMs.
A) The graph shows the distribution and median of the averaged transformed Log2 gene expression showing that the overall gene expression intensity by animal and sample type is similar in all groups. B) The graph shows a positive correlation (r2 = 0.70) of gene expression differences between GagCM9+cellsSIV+RMs (Y-axis) and CD8+cellsSIV+RMs (X-axis) relative to CD8+cellsSIV-RMs. Genes were filtered by those differentially expressed genes found when comparing GagCM9+cellsSIV+RMs with CD8+cellsSIV-RMs or CD8+cellsSIV+RMs with CD8+cellsSIV-RMs followed by FC calculations. The blue filled circles symbolize the differently expressed genes in at least one comparison between GagCM9+cellsSIV+RMs and CD8+cellsSIV+RMs to that of CD8+cellsSIV-RMs control (p<0.05). C) The Venn diagram illustrates how the 2346 genes, which were significantly altered by SIV infection (based on a significance cutoff threshold of p<0.05) overlap between the three comparisons; GagCM9+cellsSIV+RMs vs. CD8+cellsSIV+RMs, (blue circle); GagCM9+cellsSIV+RMs vs. CD8+cellsSIV-RMs (red circle); CD8+ cellsSIV+RMs vs. CD8+cellsSIV-RMs (green circle).
Fig 3
Fig 3. Heat map analysis of GagCM9+cellsSIV+RMs, CD8+cellsSIV+RMs and CD8+cellsSIV-RMs.
The heat map shows discrimination of the gene profiles of A) GagCM9+cellsSIV+RMs vs. CD8+cellsSIV+RMs; B) GagCM9+cellsSIV+RMs vs. CD8+cellsSIV-RMs and C) CD8+cellsSIV+RMs vs. CD8+cellsSIV-RMs. Independent sample t-tests (Kruskal-Wallis) were used to detect significant differences between groups. Clustering of genes was generated by unsupervised centroid linkage hierarchical clustering using Pearson correlation coefficient as the distance metric. Gene expression levels are shown in color, with red indicating over-abundant expression and blue indicating under-abundant expression.
Fig 4
Fig 4. Heat map of top five up and downregulated differentially expressed genes.
The heat map shows discrimination of the gene profiles of top five up and downregulated differentially expressed genes in the comparison between A) GagCM9+cellsSIV+RMs vs. CD8+cellsSIV+RMs and B) GagCM9+cellsSIV+RMs vs. CD8+cellsSIV-RMs. Gene expression levels are shown in color, with red indicating over-abundant expression and blue indicating under-abundant expression.

References

    1. Borrow P, Lewicki H, Hahn BH, Shaw GM, Oldstone MB. Virus-specific CD8+ cytotoxic T-lymphocyte activity associated with control of viremia in primary human immunodeficiency virus type 1 infection. Journal of virology. 1994;68(9):6103–10. Epub 1994/09/01. - PMC - PubMed
    1. Chowdhury A, Hayes TL, Bosinger SE, Lawson BO, Vanderford T, Schmitz JE, et al. Differential Impact of In Vivo CD8+ T Lymphocyte Depletion in Controller versus Progressor Simian Immunodeficiency Virus-Infected Macaques. Journal of virology. 2015;89(17):8677–86. Epub 2015/06/13. 10.1128/JVI.00869-15 - DOI - PMC - PubMed
    1. Friedrich TC, Valentine LE, Yant LJ, Rakasz EG, Piaskowski SM, Furlott JR, et al. Subdominant CD8+ T-cell responses are involved in durable control of AIDS virus replication. Journal of virology. 2007;81(7):3465–76. Epub 2007/01/26. - PMC - PubMed
    1. Jin X, Bauer DE, Tuttleton SE, Lewin S, Gettie A, Blanchard J, et al. Dramatic rise in plasma viremia after CD8(+) T cell depletion in simian immunodeficiency virus-infected macaques. The Journal of experimental medicine. 1999;189(6):991–8. Epub 1999/03/17. - PMC - PubMed
    1. Koup RA, Safrit JT, Cao Y, Andrews CA, McLeod G, Borkowsky W, et al. Temporal association of cellular immune responses with the initial control of viremia in primary human immunodeficiency virus type 1 syndrome. Journal of virology. 1994;68(7):4650–5. Epub 1994/07/01. - PMC - PubMed

Publication types

MeSH terms

Substances