. 2016 Mar 17;12(3):e1005469.
doi: 10.1371/journal.ppat.1005469. eCollection 2016 Mar.

In Vivo Molecular Dissection of the Effects of HIV-1 in Active Tuberculosis

Affiliations

In Vivo Molecular Dissection of the Effects of HIV-1 in Active Tuberculosis

Lucy C K Bell et al. PLoS Pathog. .

Abstract

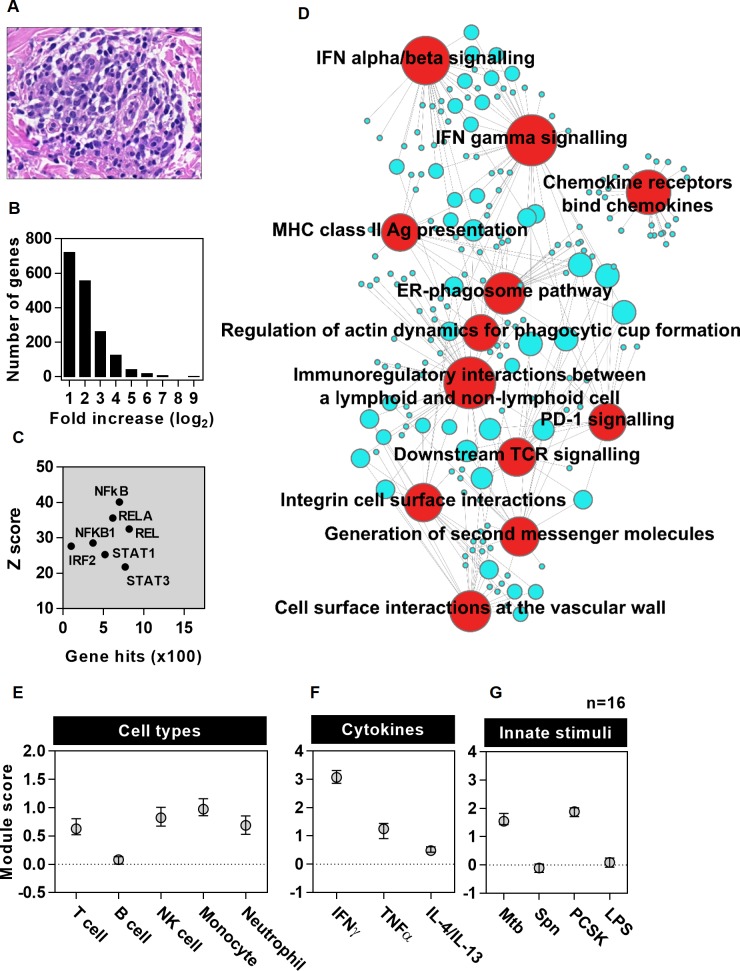
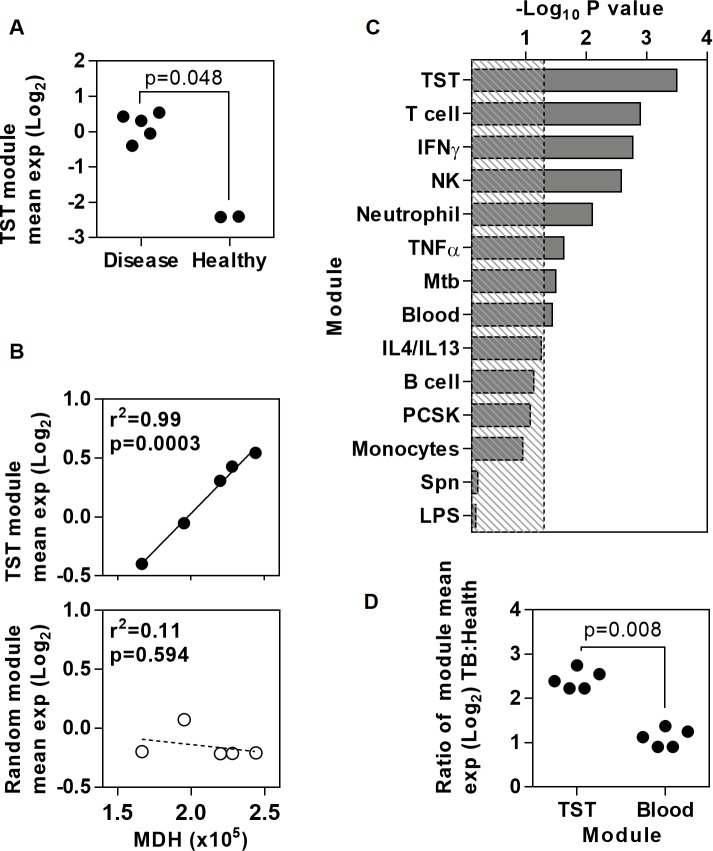
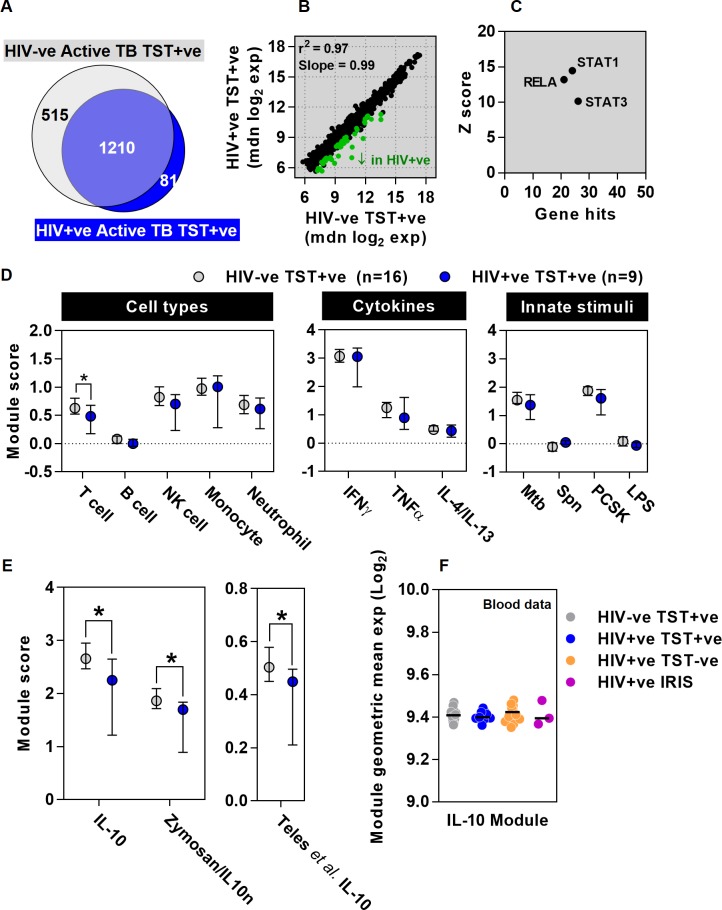
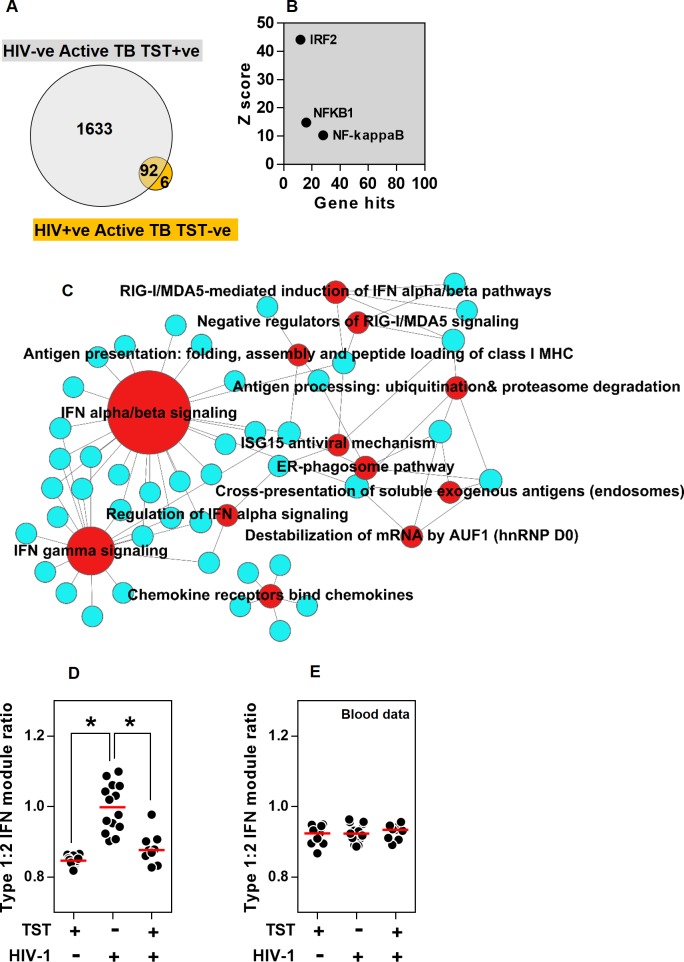
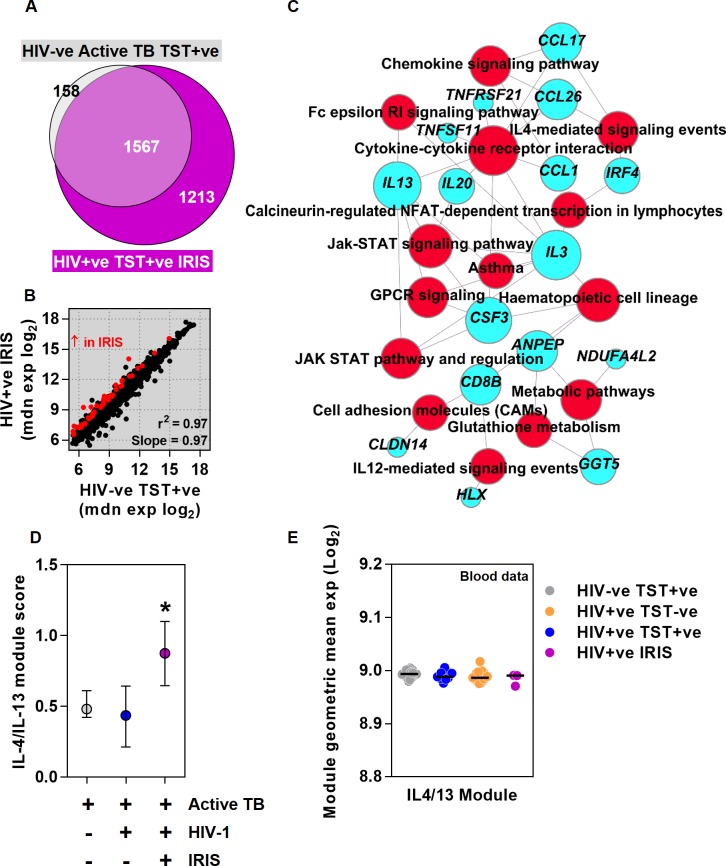
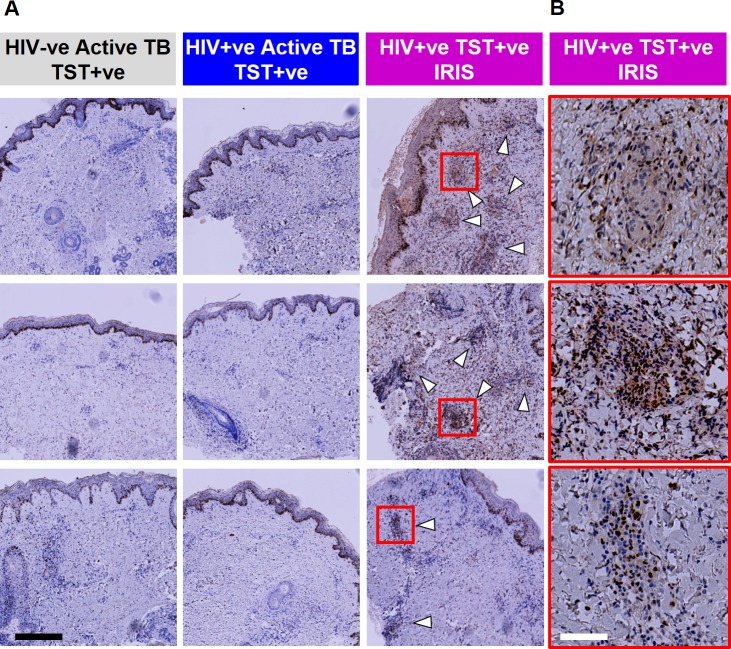
Increased risk of tuberculosis (TB) associated with HIV-1 infection is primarily attributed to deficient T helper (Th)1 immune responses, but most people with active TB have robust Th1 responses, indicating that these are not sufficient to protect against disease. Recent findings suggest that favourable outcomes following Mycobacterium tuberculosis infection arise from finely balanced inflammatory and regulatory pathways, achieving pathogen control without immunopathology. We hypothesised that HIV-1 and antiretroviral therapy (ART) exert widespread changes to cell mediated immunity, which may compromise the optimal host protective response to TB and provide novel insights into the correlates of immune protection and pathogenesis. We sought to define these effects in patients with active TB by transcriptional profiling of tuberculin skin tests (TST) to make comprehensive molecular level assessments of in vivo human immune responses at the site of a standardised mycobacterial challenge. We showed that the TST transcriptome accurately reflects the molecular pathology at the site of human pulmonary TB, and used this approach to investigate immune dysregulation in HIV-1/TB co-infected patients with distinct clinical phenotypes associated with TST reactivity or anergy and unmasking TB immune reconstitution inflammatory syndrome (IRIS) after initiation of ART. HIV-1 infected patients with positive TSTs exhibited preserved Th1 responses but deficient immunoregulatory IL10-inducible responses. Those with clinically negative TSTs revealed profound anergy of innate as well as adaptive immune responses, except for preservation of type 1 interferon activity, implicated in impaired anti-mycobacterial immunity. Patients with unmasking TB IRIS showed recovery of Th1 immunity to normal levels, but exaggerated Th2-associated responses specifically. These mechanisms of immune dysregulation were localised to the tissue microenvironment and not evident in peripheral blood. TST molecular profiling categorised different mechanisms of immunological dysfunction in HIV-1 infection beyond the effects on CD4 T cells, each associated with increased risk of TB disease and amenable to host-directed therapies.


Conflict of interest statement

The authors have declared that no competing interests exist.

Figures

Fig 1
Fig 1. Bioinformatic and modular analysis of the TST signature in HIV negative patients with active TB.
(a) Representative example of histological leukocytic infiltrate associated with a clinically positive TST. (b) Frequency distribution of median fold increases in TST transcript abundance in HIV-1 seronegative patients with active TB (n = 16) compared to site of saline injections (n = 8). TFBS enrichment analysis for this gene list is shown indicating the number of genes and statistical enrichment (Z score) associated with selected transcription factors (c). Associations with top twelve most statistically enriched REACTOME functional pathways are represented in a network plot (d), in which the edges indicate associations between genes (blue nodes) and named pathways (red nodes), and the node size is proportional to the number of associations. (e-g) Module scores represent log ratio of geometric mean of gene expression for each module within TST compared to saline biopsies (data points represent median ±IQR).
Fig 2
Fig 2. Expression of the TST signature genes in granuloma at the site of disease in pulmonary TB.
Relative mean expression of the TST gene signature from HIV-1 negative patients with active TB, or equivalent number of random genes, in transcriptional data from human lung TB granuloma (n = 5) is compared to (a) data from healthy lung (n = 2), and to (b) genome-wide MDH in TB granulomas. (c) The statistical strength of correlation between mean expression of specific gene modules and genome-wide MDH in TB granulomas. Dotted line indicates–log10 p value of 1.3 equivalent to p<0.05. (d) Relative enrichment of mean expression of the TST and peripheral blood gene signatures from HIV-1 negative patients with active TB in TB granulomas compared to healthy lung. Individual data points are shown in (a), (b) and (d). P values in (a) and (d) are derived from Mann-Whitney tests, and in (b-c) are derived from Pearson’s correlations.
Fig 3
Fig 3. Attenuation of IL10 responses in HIV-1/TB co-infected patients with clinically positive TSTs.
Comparison of increased transcript abundance in the TST of patients with active TB and clinically positive TSTs with (n = 9) and without (n = 16) HIV-1 infection, relative to the mean of saline controls (n = 8) is shown as a (a) Venn diagram, (b) scatter plot of median gene expression showing correlation (r2) and covariance (slope), highlighting the genes that show statistically significant decreased expression in green and (d) enrichment of cell-type and stimulus specific transcriptional modules. (c) TFBS enrichment analysis indicating the number of genes and statistical enrichment (Z score) associated with selected transcription factors is shown for genes that show lower transcript levels in HIV-1 infected patients. (e) Relative enrichment of two novel IL-10 inducible gene expression modules, and one previously published IL-10 module [47] in TSTs of HIV-1 infected and uninfected patients compared to saline controls. Data points (d-e) represent median ±IQR, *p<0.05 Mann-Whitney test). (f) IL10 module expression in the peripheral blood of these patient groups, showing data points for individual patients and median for each group.
Fig 4
Fig 4. Preserved type 1 IFN responses uncoupled from other immune responses in HIV-1/TB co-infected patients with clinically negative TSTs.
(a) In patients with active TB, the TST signature in HIV-1 negative patients with clinically positive TSTs (n = 16) and HIV-1 infected patients with clinically anergic TST (n = 14) are compared in a Venn diagram. For genes that show increased expression in this group of HIV-1 infected patients relative to the mean of saline controls (n = 8), (b) TFBS enrichment analysis is shown indicating the number of genes and statistical enrichment (Z score) associated for selected TFs, and associations with twelve most statistically enriched REACTOME functional pathways is represented in a network plot (c), in which the edges indicate associations between genes (blue nodes) and named pathways (red nodes), and the node size is proportional to the number of associations. Ratios of the median signal for stimulus specific type 1:2 IFN modules are shown within the (d) TST and (e) blood transcriptomes for different groups of patients with active TB as indicated, showing data points for individual patients and median for each group (*p<0.05 Mann-Whitney test).
Fig 5
Fig 5. Exaggerated Th2 responses in HIV-1 infected patients with unmasking TB-IRIS.
In patients with active TB, the TST signature in HIV-1 negative patients with clinically positive TSTs (n = 16) and HIV-1 infected patients with unmasking IRIS (n = 3), relative to the mean of saline controls (n = 8), are compared by (a) Venn diagram, and (b) scatter plot of median gene expression showing correlation (r2) and covariance (slope), highlighting the genes that show statistically significantly increased expression in red. (c) For genes that show increased expression in HIV-1 infected TB-IRIS patients, associations with statistically enriched functional pathways is represented in a network plot in which the edges indicate associations between genes (blue nodes) and named pathways (red nodes), and the node size is proportional to the number of associations. Relative enrichment of IL4/13 stimulated gene expression modules in (d) TST (median ±IQR), and (e) peripheral blood transcriptomes (data points for individual patients and median for each group) in the groups indicated (*p<0.05 Mann-Whitney test).
Fig 6
Fig 6. Increased immunostaining for IRF4 in HIV-1 infected patients with unmasking TB-IRIS.
(a) Immunostaining of IRF4 in TST biopsies from three separate patients from each of the study groups indicated (white arrows indicate areas of positive IRF4 staining associated with inflammatory infiltrates). (b) Selected inflammatory cell infiltrates in TB-IRIS cases (indicated by red squares) are shown at higher magnification. Black scale bar = 400 μM and white scale bar = 80 μM.

References

    1. WHO. WHO | Global tuberculosis report 2014 [Internet]. World Health Organisation; 2014. Available: http://www.who.int/tb/publications/global_report/en/
    1. Getahun H, Gunneberg C, Granich R, Nunn P. HIV Infection–Associated Tuberculosis: The Epidemiology and the Response. Clin Infect Dis. 2010;50: S201–S207. 10.1086/651492 - DOI - PubMed
    1. Sonnenberg P, Glynn JR, Fielding K, Murray J, Godfrey-Faussett P, Shearer S. How soon after infection with HIV does the risk of tuberculosis start to increase? A retrospective cohort study in South African gold miners. J Infect Dis. 2005;191: 150–158. 10.1086/426827 - DOI - PubMed
    1. Naing C, Mak JW, Maung M, Wong SF, Kassim AIBM. Meta-analysis: the association between HIV infection and extrapulmonary tuberculosis. Lung. 2013;191: 27–34. 10.1007/s00408-012-9440-6 - DOI - PubMed
    1. Bustamante J, Boisson-Dupuis S, Abel L, Casanova J-L. Mendelian susceptibility to mycobacterial disease: genetic, immunological, and clinical features of inborn errors of IFN-γ immunity. Semin Immunol. 2014;26: 454–470. 10.1016/j.smim.2014.09.008 - DOI - PMC - PubMed

Publication types

MeSH terms