. 2016 Mar 17;11(3):e0151717.
doi: 10.1371/journal.pone.0151717. eCollection 2016.

Characterization of the Treg Response in the Hepatitis B Virus Hydrodynamic Injection Mouse Model

Affiliations

Characterization of the Treg Response in the Hepatitis B Virus Hydrodynamic Injection Mouse Model

Kirsten K Dietze et al. PLoS One. .

Abstract

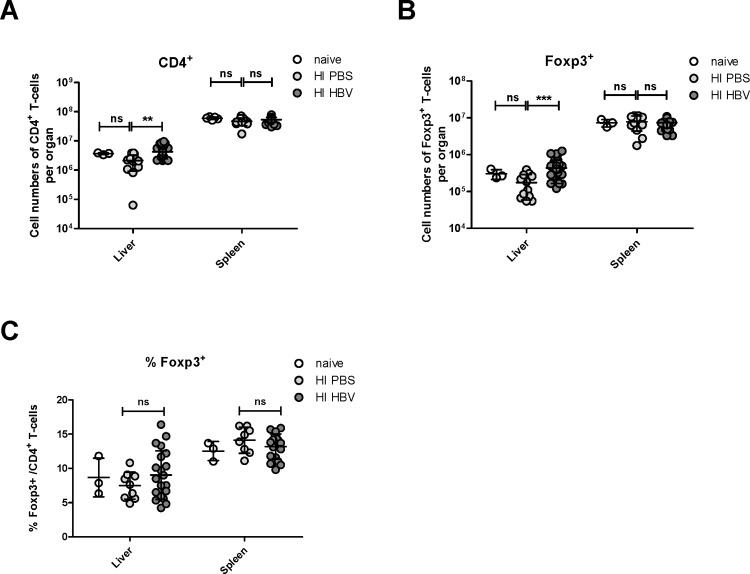
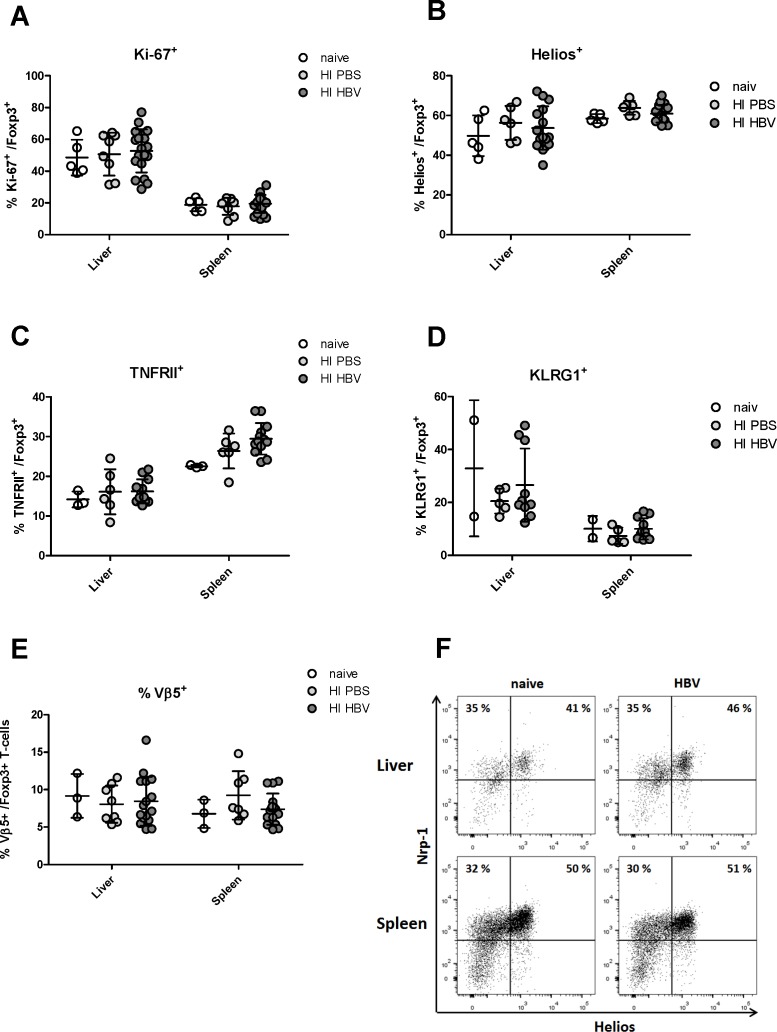
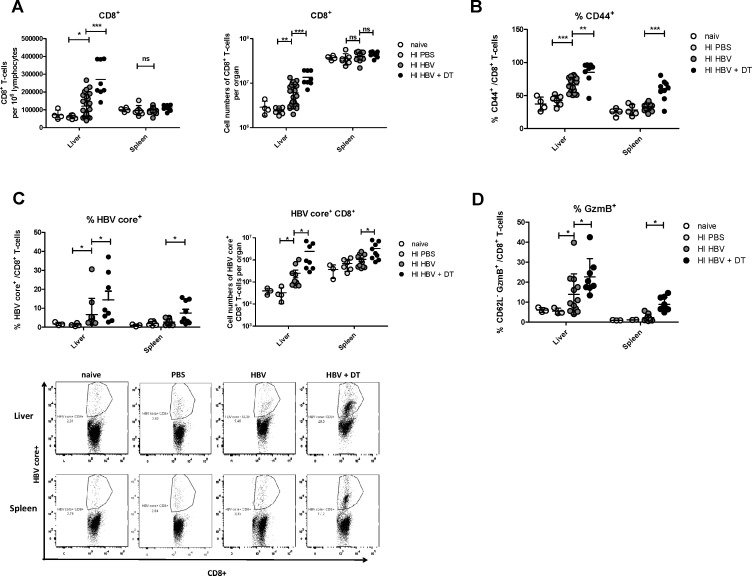
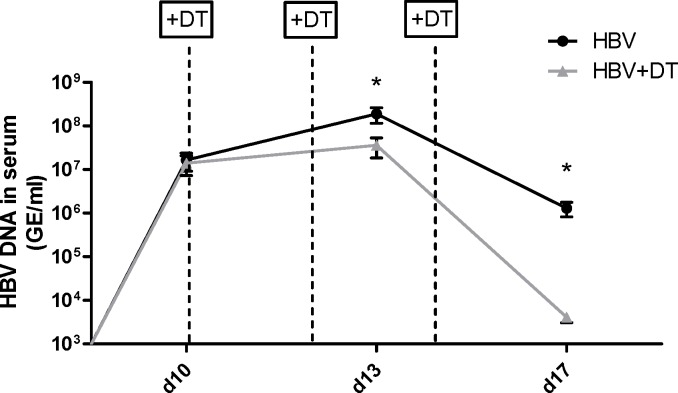
Regulatory T cells (Tregs) play an important role in counter-regulating effector T cell responses in many infectious diseases. However, they can also contribute to the development of T cell dysfunction and pathogen persistence in chronic infections. Tregs have been reported to suppress virus-specific T cell responses in hepatitis B virus (HBV) infection of human patients as well as in HBV animal models. However, the phenotype and expansion of Tregs has so far only been investigated in other infections, but not in HBV. We therefore performed hydrodynamic injections of HBV plasmids into mice and analyzed the Treg response in the spleen and liver. Absolute Treg numbers significantly increased in the liver but not the spleen after HBV injection. The cells were natural Tregs that surprisingly did not show any activation or proliferation in response to the infection. However, they were able to suppress effector T cell responses, as selective depletion of Tregs significantly increased HBV-specific CD8+ T cell responses and accelerated viral antigen clearance. The data implies that natural Tregs infiltrate the liver in HBV infection without further activation or expansion but are still able to interfere with T cell mediated viral clearance.


Conflict of interest statement

Competing Interests: The authors have declared that no competing interests exist.

Figures

Fig 1
Fig 1. Quantification of Tregs in the liver and spleen of HBV-replicating mice.
C57BL/6 mice were hydrodynamically injected with PBS or pSM2 plasmid. Flow cytometry was used to quantify CD4+ T cells and CD4+Foxp3+ Tregs in the liver and spleen 21 days after injection. (A) Absolute numbers of CD4+ T cells per organ were counted in the liver and spleen. (B) Absolute numbers of CD4+ Foxp3+ Tregs per organ were counted in the liver and spleen. (C) Treg percentages of total CD4+ T cells were calculated in the liver and spleen. Each dot represents an individual mouse. Data were pooled from 3 to 5 independent experiments with similar results. Statistical data were derived by using the GraphPad Prism software (GraphPad Software). All data sets were first tested for normality using the D’Agostino and Pearson omnibus normality test. Data was then assessed using an unpaired Student’s T-test. Statistically significant differences are indicated by asterisks (**p < 0.01, ***p < 0.001).
Fig 2
Fig 2. Phenotype analysis of Tregs in the liver and spleen of HBV-replicating mice.
C57BL/6 mice were hydrodynamically injected with PBS or pSM2 plasmid. Flow cytometry was used to quantify activation and differentiation markers Tregs in the liver and spleen 21 days after injection. The frequencies of CD4+ Foxp3+ Treg populations in the liver and spleen expressing (A) Ki67+ cells, (B) Helios+ cells, (C) TNFR2+ cells, (D) KLRG1+ cells, and (E) Vß5+ cells were enumerated and expressed as a percentage of the Treg population. Each dot represents an individual mouse. Data were pooled from 3–5 independent experiments with similar results. (F) Representative scatter plots of Neuropilin-1 against Helios are shown from a naive mouse and a HBV-replicating mouse. Cells were gated on CD4+ Foxp3+ Tregs.
Fig 3
Fig 3. Impact of Treg depletion on CD8+ T cell responses in HBV-replicating mice.
DEREG mice were hydrodynamically injected with PBS or pSM2 plasmid and were treated with DT to deplete Foxp3+ Treg on day 10, 12 and 14 after HI. Mice were sacrificed on 21dpi for CD8+ T cell response analysis by flow cytometry. (A) Absolute numbers of CD8+ T cells per 1 million lymphocytes and per organ were counted in the liver and spleen. (B) Activation markers CD44 expression in intrahepatic and splenic CD8+ T cells was measured. The frequencies of virus-specific class I dimer+ (C) and CD62L- granzyme B+ (D) CD8+ T cells in the liver and spleen were measured. Each dot represents an individual mouse. Data were pooled from 3–6 independent experiments with similar results. Statistical analysis and data presentation was performed using GraphPad Prism software. All data sets were first tested for normality using the D’Agostino and Pearson omnibus normality test. Data was then assessed using either parametric one-way analysis of variance (ANOVA). The statistical significances were calculated using the Tukey’s Multiple Comparison assessment methods. When only two groups were analyzed, data was tested using a parametric Student’s T-test. Statistically significant differences are indicated by asterisks (*p < 0.05, **p < 0.01, ***p < 0.001).
Fig 4
Fig 4. Impact of Treg depletion on HBV viral load in mice.
DEREG mice were hydrodynamically injected with PBS or pSM2 plasmid and were treated with DT to deplete Foxp3+ Treg on day 10, 12 and 14 after HI. Mice were bled at indicated time points and HBV DNA levels in the serum were quantified by realtime PCR. Statistical data were derived by using the GraphPad Prism software (GraphPad Software). Data set was first tested for normality using the D’Agostino and Pearson omnibus normality test. Data was then assessed using an unpaired Student’s T-test. Statistically significant differences are indicated by asterisks (*p < 0.05)

References

    1. Beasley RP. Rocks along the road to the control of HBV and HCC. Ann Epidemiol. 2009;19(4):231–4. Epub 2009/04/07. 10.1016/j.annepidem.2009.01.017 . - DOI - PubMed
    1. Liu J, Kosinska A, Lu M, Roggendorf M. New therapeutic vaccination strategies for the treatment of chronic hepatitis B. Virol Sin. 2014;29(1):10–6. Epub 2014/01/24. 10.1007/s12250-014-3410-5 . - DOI - PMC - PubMed
    1. Schweitzer A, Horn J, Mikolajczyk RT, Krause G, Ott JJ. Estimations of worldwide prevalence of chronic hepatitis B virus infection: a systematic review of data published between 1965 and 2013. Lancet. 2015. Epub 2015/08/02. 10.1016/S0140-6736(15)61412-X . - DOI - PubMed
    1. Liu J, Zhang E, Ma Z, Wu W, Kosinska A, Zhang X, et al. Enhancing virus-specific immunity in vivo by combining therapeutic vaccination and PD-L1 blockade in chronic hepadnaviral infection. PLoS Pathog. 2014;10(1):e1003856 Epub 2014/01/07. 10.1371/journal.ppat.1003856 - DOI - PMC - PubMed
    1. Thimme R, Wieland S, Steiger C, Ghrayeb J, Reimann KA, Purcell RH, et al. CD8(+) T cells mediate viral clearance and disease pathogenesis during acute hepatitis B virus infection. J Virol. 2003;77(1):68–76. Epub 2002/12/13. - PMC - PubMed

Publication types