. 2016 Mar 18:6:23258.
doi: 10.1038/srep23258.

Substrate engagement of integrins α5β1 and αvβ3 is necessary, but not sufficient, for high directional persistence in migration on fibronectin

Affiliations

Substrate engagement of integrins α5β1 and αvβ3 is necessary, but not sufficient, for high directional persistence in migration on fibronectin

Dimitris Missirlis et al. Sci Rep. .

Abstract

The interplay between specific integrin-mediated matrix adhesion and directional persistence in cell migration is not well understood. Here, we characterized fibroblast adhesion and migration on the extracellular matrix glycoproteins fibronectin and vitronectin, focusing on the role of α5β1 and αvβ3 integrins. Fibroblasts manifested high directional persistence in migration on fibronectin-, but not vitronectin-coated substrates, in a ligand density-dependent manner. Fibronectin stimulated α5β1-dependent organization of the actin cytoskeleton into oriented, ventral stress fibers, and assembly of dynamic, polarized protrusions, characterized as regions free of stress fibers and rich in nascent adhesions at their edge. Such protrusions correlated with persistent, local leading edge advancement, but were not sufficient, nor necessary for directional migration over longer times. Selective blocking of αvβ3 or α5β1 integrins using small molecule integrin antagonists reduced directional persistence on fibronectin, indicating integrin cooperativity in maintaining directionality. On the other hand, patterned substrates, designed to selectively engage either integrin, or their combination, were not sufficient to establish directional migration. Overall, our study demonstrates adhesive coating-dependent regulation of directional persistence in fibroblast migration and challenges the generality of the previously suggested role of β1 and β3 integrins in directional migration.


Figures
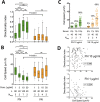
Figure 1
Figure 1. Fibroblasts migrate persistently on FN but not on VN.
(A) REFWT directionality index (DI) and (B) cell speed as a function of FN or VN coating concentration on TCPS-coated substrates. DI equals the ratio of the final distance a cell moved from the origin to the total trajectory length. The middle line in box plots indicates the median, the box indicates the interquartile range, the whiskers the 5th and 95th percentiles and the cross the mean. Data for each coating were analyzed using one-way ANOVA with Tukey post-test analysis: ns: not significant; *P < 0.05, **P < 0.01; ***P < 0.001; ****P < 0.0001. Data for 10 μg/ml FN and VN coating concentration were compared using an unpaired t-test. (C) Serum was required for stimulating REFWT migration as indicated by the low cell speed and percentage of motile cells (indicated by % on the graph) in presence of 1% serum or absence of serum in the culture medium. Black lines in dot plot represent mean values. (D) No correlation was observed between DI and cell speed for REFWT migrating on each substrate (data presented for coating concentrations of 1 and 10 μg/ml). n: number of analyzed cells; Nexp: number of independent experiments.
Figure 2
Figure 2. Distinct fibroblast spreading, adhesion plaque organization and cytoskeleton organization on FN versus VN.
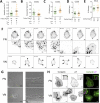
REFWT projected cell area (A) and aspect ratio (B) 6 hours post-seeding were significantly higher on FN- compared to VN-coated substrates (n: number of analyzed cells). (C) Actin microfilament staining and YFP-PAX localization in REFYFP-PAX 6 hours post-seeding revealed important differences in stress fiber and adhesion plaque organization (see main text for details). (D) Stress fiber orientation was quantified using a custom-written algorithm and showed a high degree of fiber alignment on FN and random orientation on VN (details in the materials & methods section; the 0° angle corresponds to the maximum for each cell; mean and SEM from n > 15 cells and 2 independent experiments are presented). (E,F) FA area quantification based on YFP-paxillin clustering (E) or anti-pY staining (F) revealed formation of larger FAs on VN compared to FN (n: number of FAs; mean values are shown on graph). (G) Quantification of anti-pY fluorescence intensity of FAs normalized to FA area was higher on VN (n: number of FAs from Ncells). (H) Quantification of FA number per cell showed a higher number of FAs present on fibroblasts adhered on FN compared to VN (n: number of cells). However, as the number of FAs per cell was correlated with cell area (I), the difference of FA number per unit cell area was not significant between coatings (J). The middle line in box plots indicates the median, the box indicates the interquartile range, the whiskers the 5th and 95th percentiles and the cross the mean. Black lines in dot plots (H,J) represent mean values. Nexp: number of independent experiments. Experimental data were analyzed using unpaired t-tests.
Figure 3
Figure 3. Immunofluorescence microscopy and western blotting of FA components reveal distinct adhesion cluster composition and organization on FN versus VN.
REFYFP-PAX (A,C,E) or REFWT (B,D) were cultured for 6 hours on FN- or VN-coated glass, fixed, stained against indicated FA proteins and examined with epifluorescence microscopy. (A) Alpha 5 integrin clustered efficiently on FN but not VN. Normalized intensity profiles along the lines in the images are presented. (B) Immunofluorescence imaging of ILK revealed its efficient recruitment to NAs on FN and FAs on both coatings. Quantification of the ILK:paxillin ratio revealed only a minor (8%) reduction in ILK:paxillin ratio per focal adhesion on VN (n: number of analyzed FAs; Ncells: number of analyzed cells; mean values are indicated on graph), indicating similar recruitment on both coatings. The middle line in box plots indicates the median, the box indicates the interquartile range, the whiskers the 5th and 95th percentiles and the cross the mean. (C) Staining against pY and ratio imaging in respect to paxillin revealed enhancement of tyrosine phosphorylation on peripheral NAs compared to mature FAs on FN, and inhomogeneous pY levels within FAs on VN, with the distal part exhibiting higher fluorescence intensity. (D,E) pFAK(Y397) and pPAX(Y118) displayed similar distribution as pY. (F) Western blot analysis for pFAK(Y397), FAK, pPAX(Y118), PAX, pCofilin(S3), cofilin, pSrc(Y416) and Src from lysates of REFWT in suspension or after plating on FN or VN, for 15 or 30 minutes. Blots are representative of 3 independent experiments and graphs represent their quantification (mean ± SEM). Scale Bars: 10 μm.
Figure 4
Figure 4. NA localization, lamellipodia dynamics and FA stability depend on the type of adhesive coating.
(A) FA assembly rates, (B) disassembly rates and (C) lifetimes were calculated for REFYFP-PAX spreading on FN- and VN-coated glass substrates. (D,E) FRAP experiments on mature FAs (>2 μm2) close to the periphery of REFYFP-PAX cultured on FN or VN were performed to estimate paxillin turnover (1 of 3 independent experiments presented). Half-life of fluorescence recovery after paxillin photobleaching (D) and mobile fraction (E) did not show significant differences in paxillin turnover within FAs (n = 30 FAs from 30 cells). (F) Individual frames from time-lapse TIRF imaging of REFYFP-PAX on FN- or VN-coated glass substrates. The time after cell seeding is indicated. NAs on FN assembled persistently at the protruding edge (which changed location between 150 and 180 minutes), whereas new adhesions formed randomly around the cell periphery on VN (indicated by arrows). (G) Kymograph analysis of REFWT seeded on FN or VN (yellow lines in phase contrast images) revealed smoother lamellipodia and slower protrusion/retraction cycles on FN. (H) Immunofluorescence microscopy against cortactin and pY of REFWT cells cultured for 6 hours on FN or VN. Scale bars: 10 μm. Mean and SEM values are presented in dot plots. Experimental data were compared using the unpaired t-test.
Figure 5
Figure 5. Myosin-II activity is required for directional persistence but cell-level traction forces do not differ between FN and VN.
(A) REFWT DI and (B) cell speed on FN and VN (10 μg/ml) in presence of 0.1% DMSO, 5 μM Y-27632 or 25 μM blebbistatin are presented as box plots (middle line indicates the median, the cross the mean, the box the interquartile range, the whiskers the 5th and 95th percentiles). Data for control conditions are included and are the same as in Fig. 1. Selected columns were compared using unpaired t-tests. n: number of analyzed cells; Nexp: number of independent experiments. (C) Total traction force per cell calculated using traction force microscopy on FN- or VN-coated polyacrylamide substrates of two different elasticities (Young’s moduli of 6 or 12 kPa). An increase in traction force for the stiffer gels was observed but no significant differences between coatings. Experimental data on different coatings were compared using unpaired t-tests and between different elasticities using one-way ANOVA with Tukey post-test analysis (n.s.: not significant; ***p < 0.001).
Figure 6
Figure 6. Blocking of α5β1 or αvβ3 integrins inhibits directional migration.
(A) REFWT cell speed and (B) DI on FN (10 μg/ml) in presence of indicated soluble, integrin-selective antagonists. A significant increase in cell speed and a decline in directional persistence was observed following α5β1 or αvβ3 blocking. Data for control (FN) are included for comparisons and are the same as in Fig. 1. (C) Projected cell area and (D) aspect ratio of REFWT cultured for 5 hours on FN and then incubated for 1 hour with soluble integrin antagonists. Blocking of α5β1 resulted in a substantial cell area reduction, while blocking of αvβ3 in an increase of aspect ratio. (E) Quantification of FA area based on anti-pY staining revealed a pronounced increase in FA size following α5β1 blocking (n: number of analyzed FAs; mean value indicated on graphs). (F) Stress fiber orientation was not affected by αvβ3 blocking, but became more random following α5β1 blocking. Mean and SEM values from at least 10 cells from 2 independent experiments are presented; the green line represents data for the FN control (same as in Fig. 2D). (G) Representative immunofluorescence images of REFWT after selective integrin blocking show adhesion plaque and actin cytoskeleton remodeling following α5β1 but not αvβ3 blocking. The middle line in box plots indicates the median, the box indicates the interquartile range, the whiskers the 5th and 95th percentiles and the cross the mean. Nexp: number of independent experiments. Experimental data were compared using one-way ANOVA with Tukey’s post-test analysis (A–D) or with Bonferroni’s post-test analysis (E). Only statistically significant differences are shown: **P < 0.01, ***P < 0.001, ****P < 0.0001. Scale bars: 10 μm.
Figure 7
Figure 7. Immobilized α5β1 and αvβ3 integrin selective ligands on patterned substrates do not promote high directional persistence in fibroblast migration.
(A) REFYFP-PAX actin cytoskeleton and YFP-paxillin clustering 6 hours post-seeding on patterned gold particles with a 50 nm average inter-particle distance, and functionalized with the indicated ligands. Stress fiber morphology on α5β1- and αvβ3-selective surfaces resembles that on FN and VN, respectively. FAs, but not NAs nor polarized protrusions, are present on patterned substrates, independent of the type of immobilized ligands. (B,C) Quantification of REFWT projected cell area (B) and aspect ratio (C) 6 hours post-seeding on patterned gold particles with a 50 nm average inter-particle distance (n > 100 cells). (D) Cell speed increased on patterned substrates with a 50 nm inter-particle distance presenting both α5β1- and αvβ3-selective ligands (1:1 ratio) compared to substrates presenting these ligands alone (n = 60 cells from Nexp = 3). Decreasing the inter-particle distance to 30 nm resulted in a slight decrease in cell speed when both ligands were present (n = 60 cells from Nexp = 2). (E) DI remained very low for REFWT on all substrates, independent of integrin ligand type or density, indicating random migration on patterned substrates. The middle line in box plots indicates the median, the box indicates the interquartile range, the whiskers the 5th and 95th percentiles and the cross the mean. Experimental data were compared using one-way ANOVA with Tukey’s post-test analysis. Only statistically significant differences are shown: *P < 0.05; **P < 0.01, ***P < 0.001, ****P < 0.0001. Scale bars: 10 μm.

References

    1. Parsons J. T., Horwitz A. R. & Schwartz M. A. Cell adhesion: integrating cytoskeletal dynamics and cellular tension. Nat. Rev. Mol. Cell Biol. 11, 633–643 (2010). - PMC - PubMed
    1. Ridley A. J. et al.. Cell migration: integrating signals from front to back. Science 302, 1704–1709 (2003). - PubMed
    1. Kim H.-D. & Peyton S. R. Bio-inspired materials for parsing matrix physicochemical control of cell migration: A Review. Integr. Biol. 4, 37–52 (2012). - PubMed
    1. Geiger B., Spatz J. P. & Bershadsky A. D. Environmental sensing through focal adhesions. Nat. Rev. Mol. Cell Biol. 10, 21–33 (2009). - PubMed
    1. Plow E. F., Haas T. A., Zhang L., Loftus J. & Smith J. W. Ligand binding to integrins. J. Biol. Chem. 275, 21788 (2000). - PubMed

Publication types