. 2016 Mar 18:6:23337.
doi: 10.1038/srep23337.

Contrast-enhanced optical coherence tomography with picomolar sensitivity for functional in vivo imaging

Affiliations

Contrast-enhanced optical coherence tomography with picomolar sensitivity for functional in vivo imaging

Orly Liba et al. Sci Rep. .

Abstract

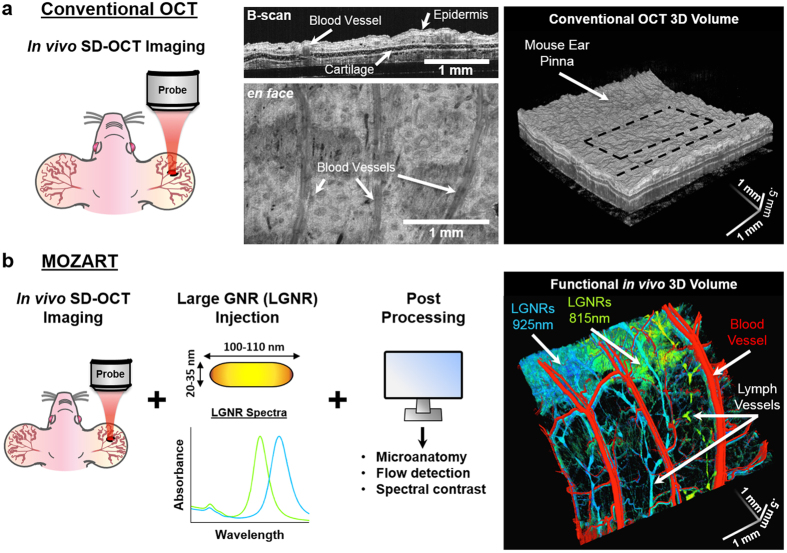
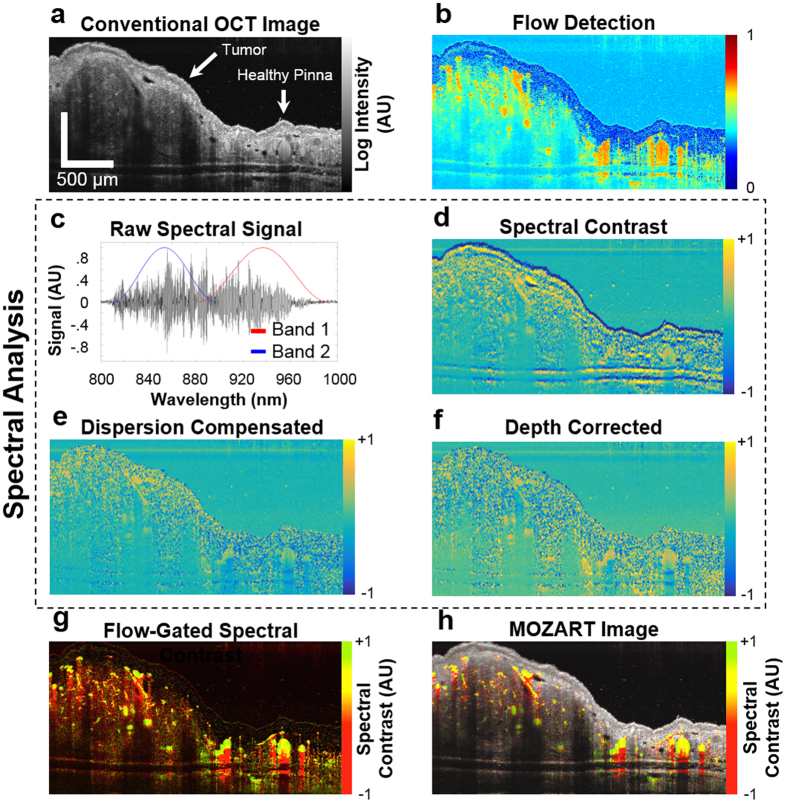
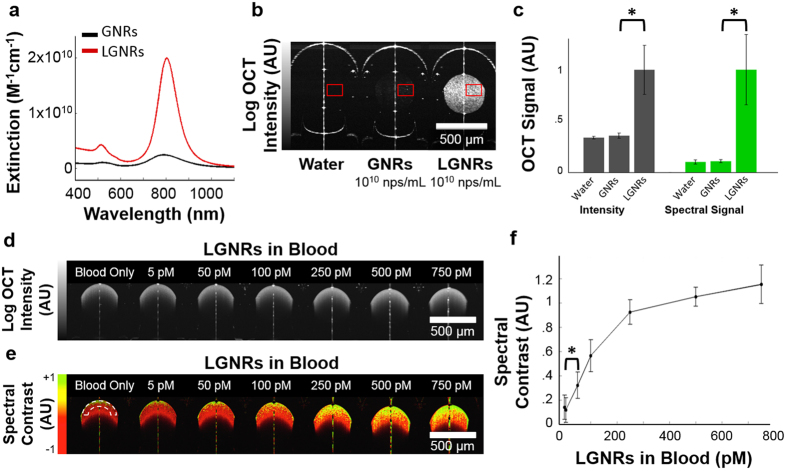
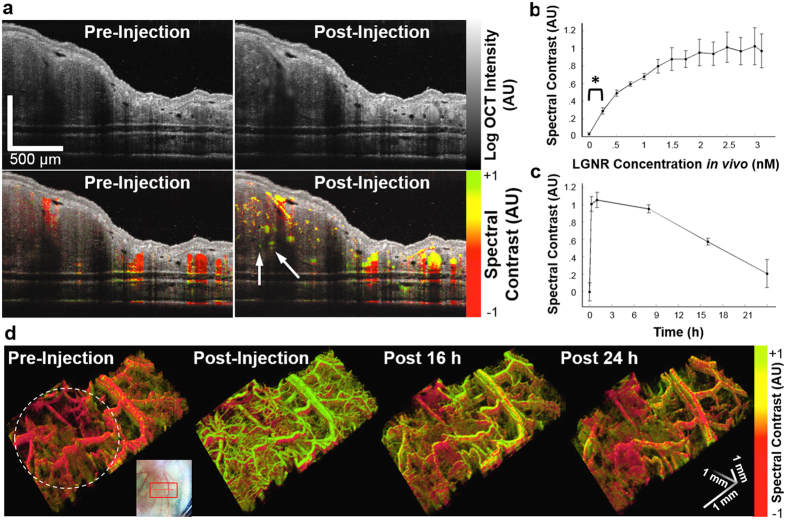
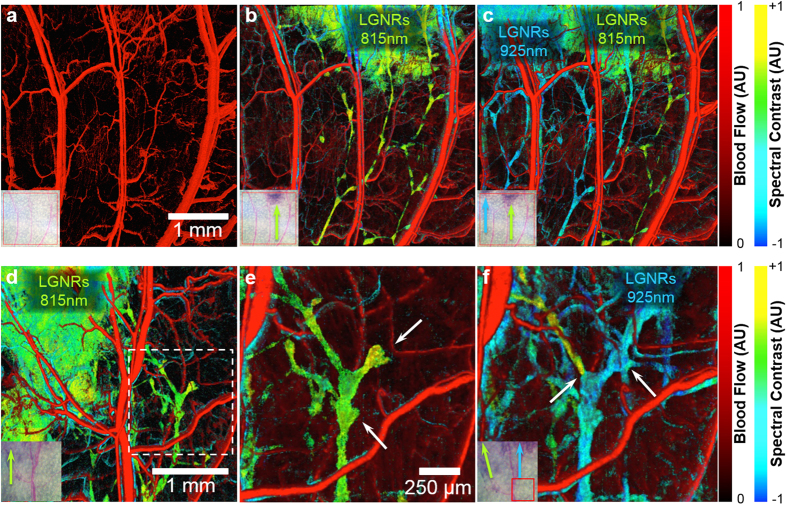
Optical Coherence Tomography (OCT) enables real-time imaging of living tissues at cell-scale resolution over millimeters in three dimensions. Despite these advantages, functional biological studies with OCT have been limited by a lack of exogenous contrast agents that can be distinguished from tissue. Here we report an approach to functional OCT imaging that implements custom algorithms to spectrally identify unique contrast agents: large gold nanorods (LGNRs). LGNRs exhibit 110-fold greater spectral signal per particle than conventional GNRs, which enables detection of individual LGNRs in water and concentrations as low as 250 pM in the circulation of living mice. This translates to ~40 particles per imaging voxel in vivo. Unlike previous implementations of OCT spectral detection, the methods described herein adaptively compensate for depth and processing artifacts on a per sample basis. Collectively, these methods enable high-quality noninvasive contrast-enhanced imaging of OCT in living subjects, including detection of tumor microvasculature at twice the depth achievable with conventional OCT. Additionally, multiplexed detection of spectrally-distinct LGNRs was demonstrated to observe discrete patterns of lymphatic drainage and identify individual lymphangions and lymphatic valve functional states. These capabilities provide a powerful platform for molecular imaging and characterization of tissue noninvasively at cellular resolution, called MOZART.


Conflict of interest statement

O.L., E.D.S. and A.d.l.Z. are listed as inventors on a provisional patent application (62/113,220) related to this work.

Figures

Figure 1
Figure 1. Overview of MOZART and its in vivo imaging capabilities.
(a) Conventional OCT scan of the mouse pinna shows micro-anatomic structures in 2D (B-scan), 2D en face slice, and volumetric rendering. The dashed lines on the volumetric rendering of the OCT structure show the locations of the B-scan and en face slice. (b) MOZART combines SD-OCT with large GNRs (LGNRs) as contrast agents that are detected with custom adaptive post-processing algorithms. This approach can be used to create images that contain additional functional information in vivo. The MOZART image reveals subcutaneously-injected LGNRs with two different spectra (green and cyan) draining into lymph vessels as well as flow in blood vessels (overlay in red). The conventional OCT and MOZART 3D images depict the same region (each volume is 4 mm × 4 mm × 1 mm).
Figure 2
Figure 2. Description of post processing steps and results.
(a) OCT log intensity image, showing the structure of a tumor on the pinna after IV injection of LGNRs. (b) Result of the flow detection algorithm. The image includes vertical shadowing below the vessels, which is a typical artifact of speckle variance methods for detecting flow. (c) The recorded interferogram is divided into two bands for implementation of a dual-band approach to detect LGNRs. The black line shows the interferogram after the subtraction of the spectrum of the SLD. The red and blue lines show the Hann filters used to window the interferogram. (d) Logarithmic representation of the spectral contrast. (e) As in (d), after iterative dispersion compensation. (f) As in (e), after applying depth-dependent gain to the bands to compensate for depth-dependent spectral aberrations. (g) Flow detection (intensity) combined with the spectral contrast (hue) to create a spectral map of the blood vessels in the tumor following LGNR injection. LGNRs in the blood vessels are shown in yellow-green. Regions below LGNRs appear red due to the spectral neutrality of the tissue below the blood vessels. (h) As in (g), with the inclusion of OCT intensity signal in gray scale to show tissue anatomy. Scale bars are 500 μm.
Figure 3
Figure 3. Evaluation of GNR and LGNR contrast.
(a) LGNRs exhibit ~8-fold greater total extinction than conventional GNRs at equal nanoparticle concentration (nps/mL). GNRs and LGNRs are shown in black and red, respectively. (b) When prepared to equivalent particle concentrations (1 × 1010 nps/mL), LGNRs exhibit significantly greater OCT signal than GNRs. At this concentration, GNRs are barely visible above the noise threshold of the system. GNRs were imaged inside circular glass capillary tubes that exhibit strong specular reflections, shown as high signal vertical line artifacts. (c) Quantitative analysis of the regions outlined in (b) shows that LGNRs exhibit ~30-fold greater OCT intensity and ~110-fold greater spectral signal than GNRs per particle (*p < 0.001 in each case). The noise level was subtracted from all values. (d) Log OCT intensity of increasing concentrations of LGNRs in blood. (e) The spectral contrast of samples in (d) without depth-dependent compensation, showing the increase in spectral hue from red to yellow-green as LGNR concentration increases. The dashed line shows the region that was analyzed for quantification of spectral contrast. (f) Quantification of spectral contrast of LGNR concentrations in blood. Each measurement is the average spectral contrast over 4 A-scans within analyzed regions in (e). These regions were selected to reduce the effect of absorption on the spectral contrast. We are able to detect LGNRs at concentration as low as 50 pM (*p < 0.001). Scale bars are 500 μm. Quantitative data are presented as mean ± SD.
Figure 4
Figure 4. Contrast enhancement of OCT images of an in vivo tumor model.
(a) OCT log intensity images (top) and combined spectral contrast images (bottom), before (left) and after (right) IV injection of LGNRs-Ab. LGNRs-Ab are detected in the blood vessels, which are shown in red before the injection and appear yellow-green after injection due to LGNR-Ab spectral signal. LGNRs-Ab enhance the ability to see small blood vessels deep in the tumor (white arrows). Scale bars are 500 μm. (b) Spectral signal in the blood vessels during an incremental injection of LGNRs-Ab IV. Measurements were collected from three mice and three blood vessels per mouse. We are able to detect LGNRs-Ab from the first incremental injection, which is equivalent to a LGNR-Ab concentration of 250 pM in the blood (*p < 0.001). (c) Spectral signal in the blood vessels before and up to 24 h after IV injection of LGNRs-Ab. Measurements were collected from three mice and three blood vessels each. (d) 3D volumes (4 mm × 2 mm) of spectral contrast signal in blood vessels of tumor (circled by dashed white line) and adjacent healthy tissue before and 0, 16, and 24 h after LGNR-Ab injection. The color scale is the same as in (a). The inset shows 2D and 3D scan locations on top of a photograph of the mouse ear. Quantitative data are presented as mean ± SEM.
Figure 5
Figure 5. Study of LGNRs-PSS-mPEG draining into lymph vessels of the pinnae in vivo.
(a) En face view of flow detection, showing the blood vessels (in red) prior to injection. The inset is a photograph of the ear showing the scanned region. (b) The spectral contrast showing the first injection of 815 nm LGNRs (shown as green) with an overlay of the blood vessels from (a). (c) As in (b), after the second injection, of 925 nm LGNRs (shown as cyan-blue). The LGNRs are filling the lymph vessels and draining from the injection sites at the edge of the ear (top of image) to the base of the ear (bottom of image). (d) En face view of a separate mouse after an injection of 815 nm LGNRs at the left side of the image. (e) A close-up view of the region marked by a dashed line in (d), showing a junction in the lymph network. The location of valves between adjacent lymphangions can be clearly observed (white arrows). One lymphangion appears to have a dead-end, indicating the location of a valve and the lack of bidirectional LGNR flow. (f) The same region as in (e), after an injection of 925 nm LGNRs at the right side of the image. Both 815 nm and 925 nm LGNRs reach the lymphatic junction. The lymph vessel on the left side of the junction still contains 815 nm LGNRs (green) while a previously-unseen vessel on the right side and the vessel downstream of the junction show 925 nm LGNRs (cyan-blue). Unidirectional lymph flow is evidenced by both the abrupt separation of 815 nm and 925 nm LGNRs at the left side valve junction and the full right side vessel upstream of the previously-observed dead end after the 925 nm LGNR injection (white arrows).

References

    1. Haubner R. et al.. Noninvasive visualization of the activated αvβ3 integrin in cancer patients by positron emission tomography and [18F] Galacto-RGD. PLoS Med. 2(3), e70 (2005). - PMC - PubMed
    1. de la Zerda A. et al.. Ultrahigh sensitivity carbon nanotube agents for photoacoustic molecular imaging in living mice. Nano Lett. 10(6), 2168–2172 (2010). - PMC - PubMed
    1. Homan K. A. et al.. Silver nanoplate contrast agents for in vivo molecular photoacoustic imaging. ACS Nano 6(1), 641–650 (2012). - PMC - PubMed
    1. Siphanto R. I. et al.. Serial noninvasive photoacoustic imaging of neovascularization in tumor angiogenesis. Opt. Express 13(1), 89–95 (2005). - PubMed
    1. Zhang H. F., Maslov K., Stoica G. & Wang L. V. Functional photoacoustic microscopy for high-resolution and noninvasive in vivo imaging. Nat. Biotechnol. 24(7), 848–851 (2005). - PubMed

Publication types