. 2016 Mar 18:7:11005.
doi: 10.1038/ncomms11005.

A CEP215-HSET complex links centrosomes with spindle poles and drives centrosome clustering in cancer

Affiliations

A CEP215-HSET complex links centrosomes with spindle poles and drives centrosome clustering in cancer

Pavithra L Chavali et al. Nat Commun. .

Abstract

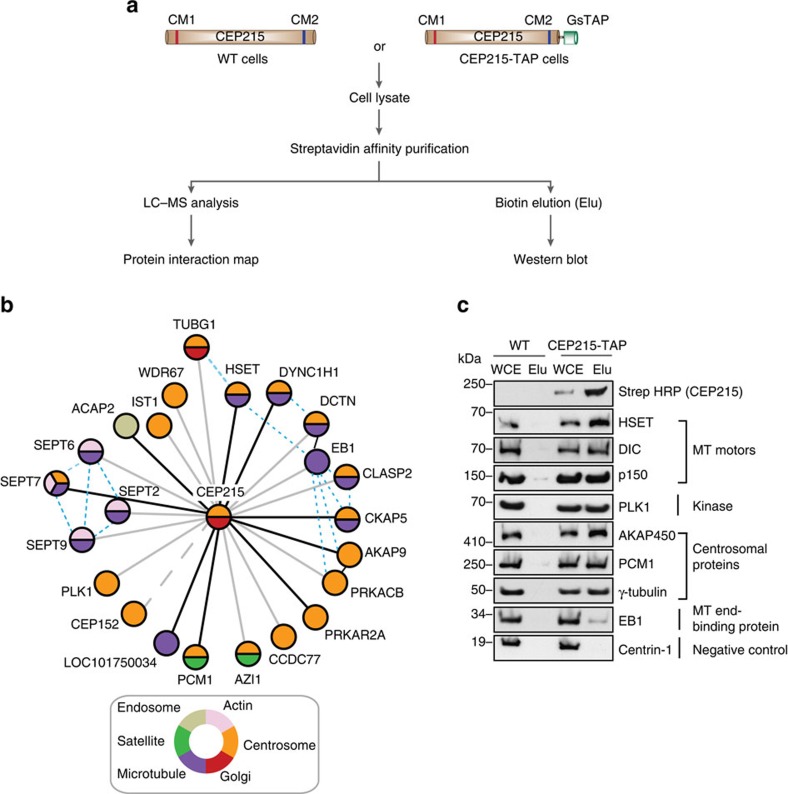
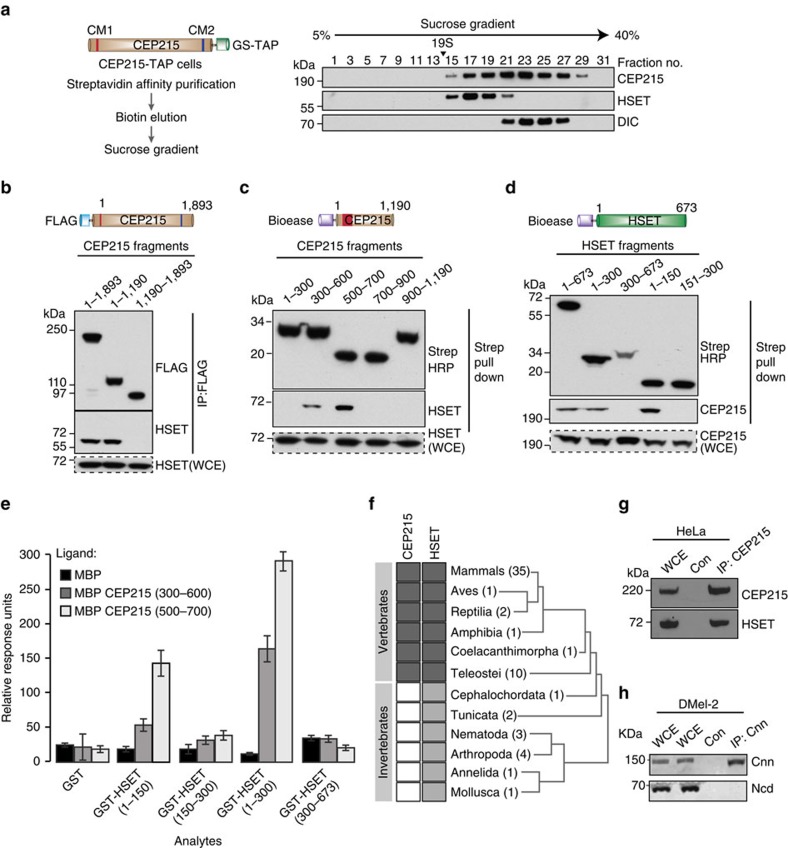
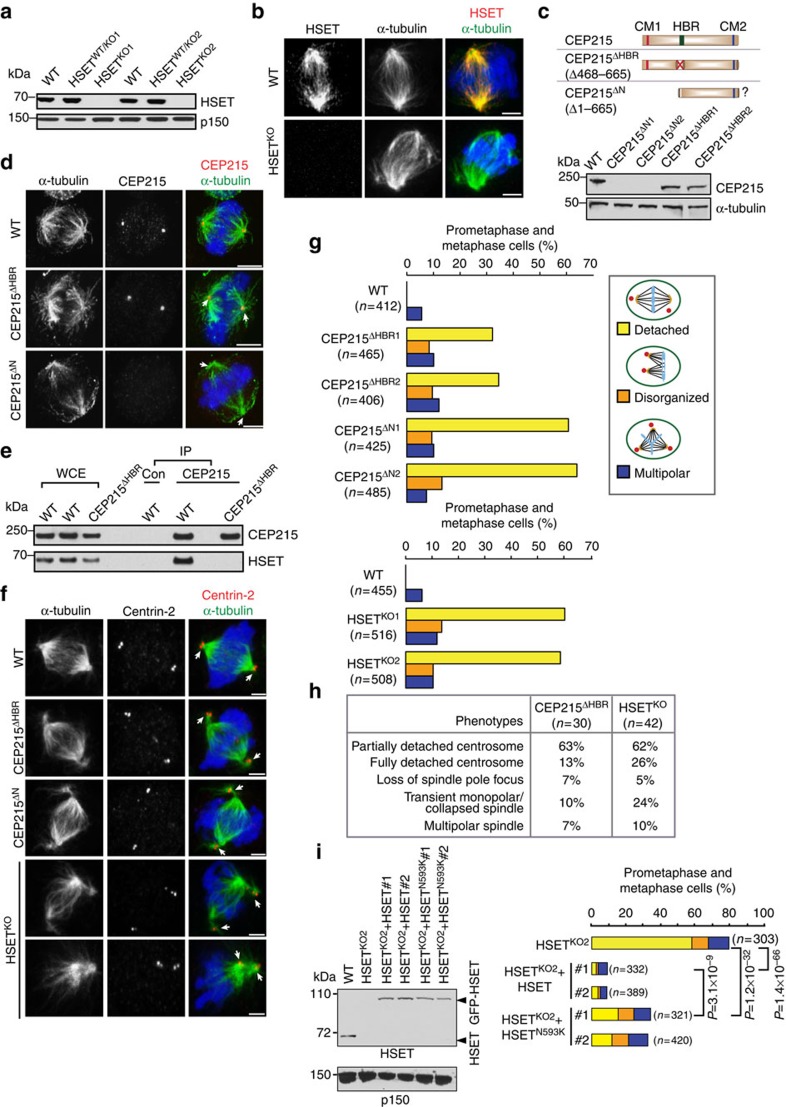
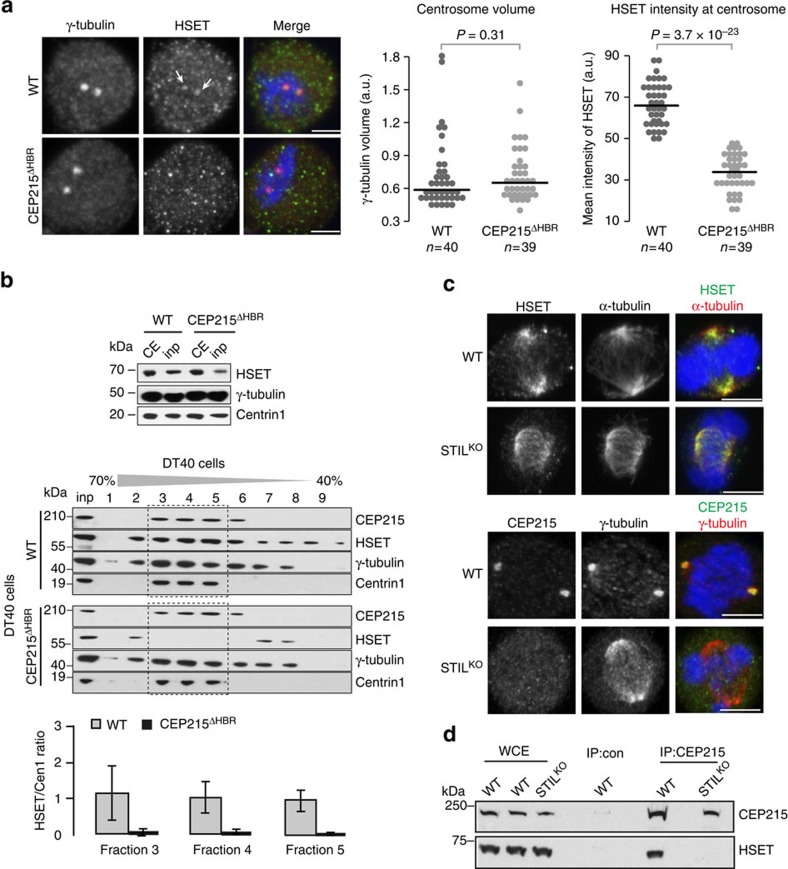
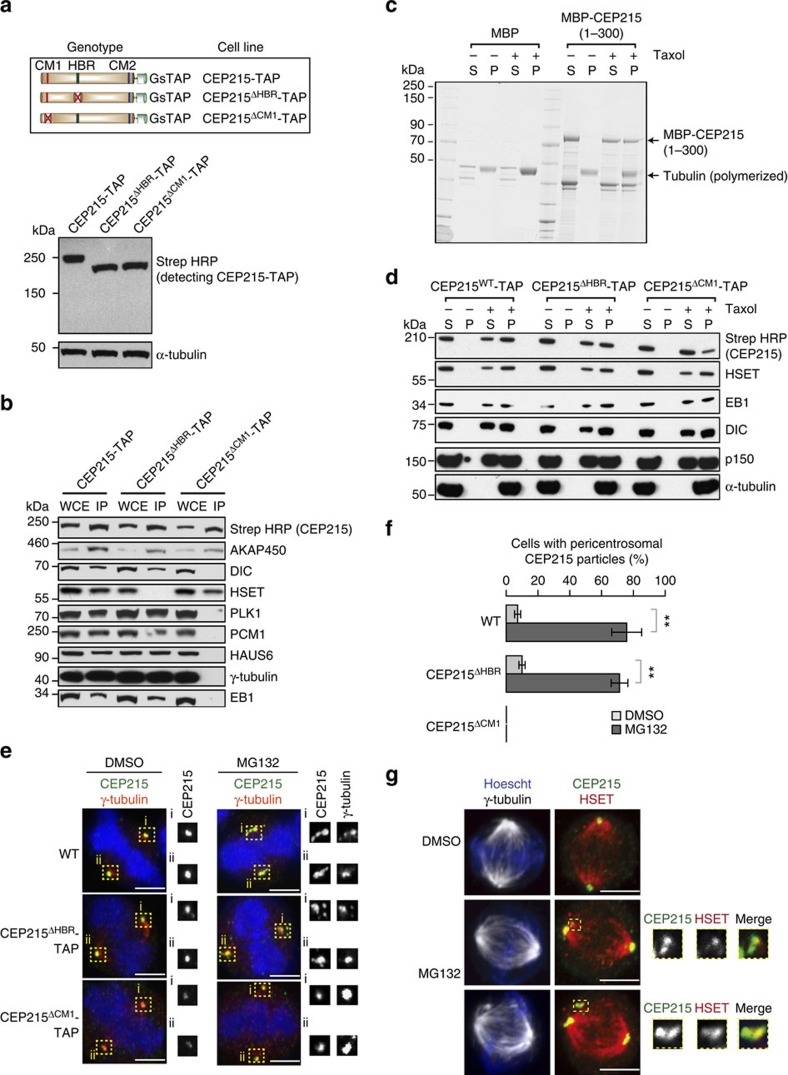
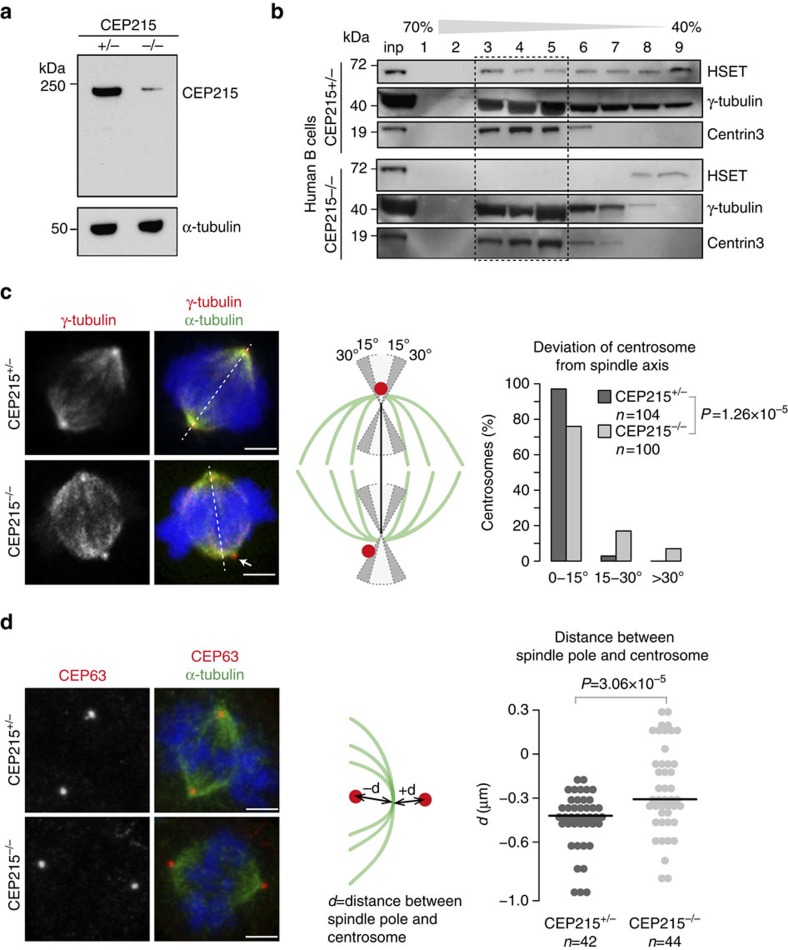
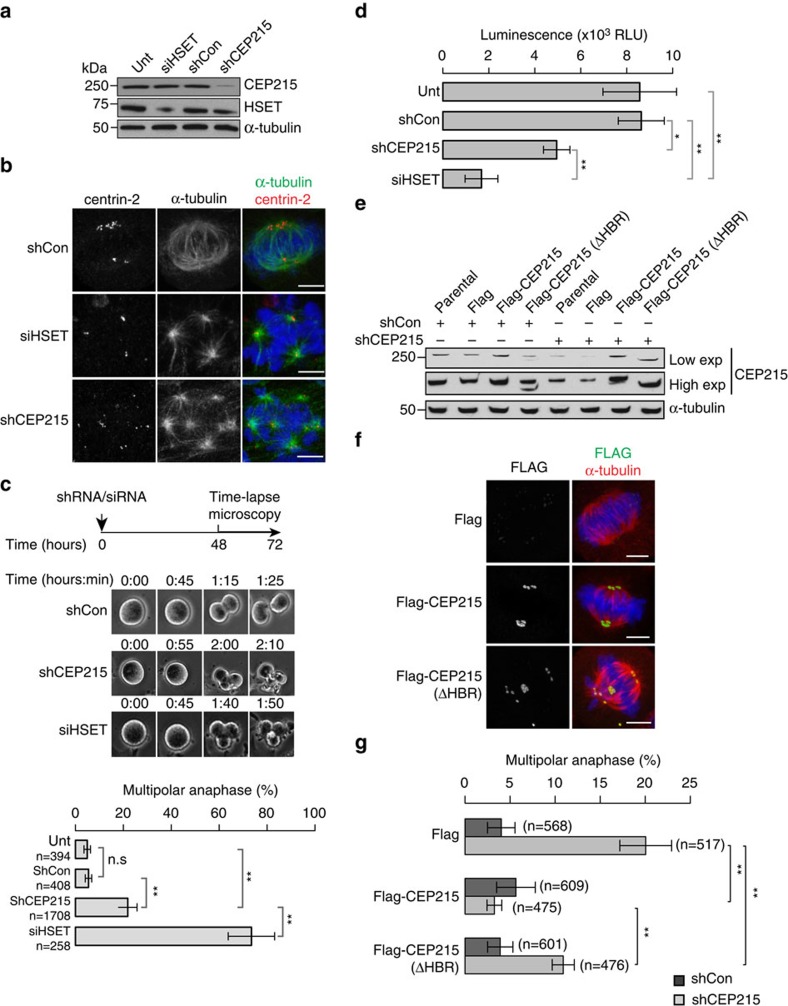
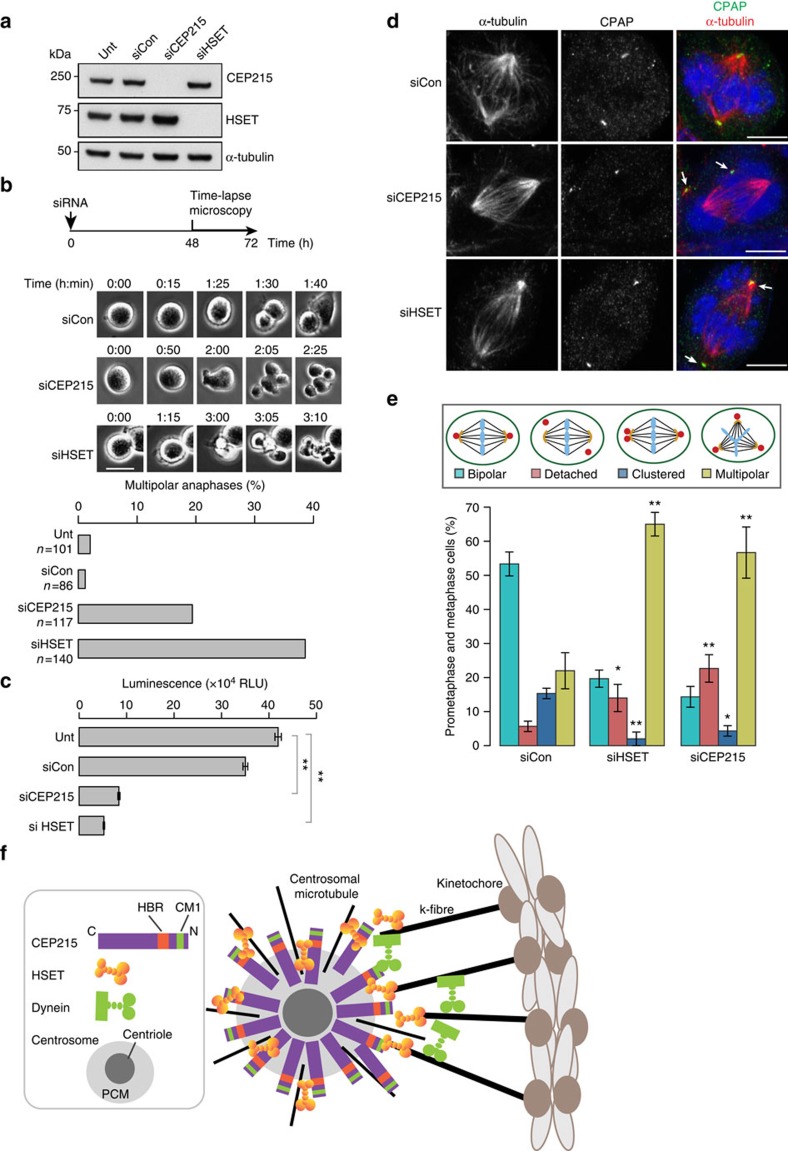
Numerical centrosome aberrations underlie certain developmental abnormalities and may promote cancer. A cell maintains normal centrosome numbers by coupling centrosome duplication with segregation, which is achieved through sustained association of each centrosome with a mitotic spindle pole. Although the microcephaly- and primordial dwarfism-linked centrosomal protein CEP215 has been implicated in this process, the molecular mechanism responsible remains unclear. Here, using proteomic profiling, we identify the minus end-directed microtubule motor protein HSET as a direct binding partner of CEP215. Targeted deletion of the HSET-binding domain of CEP215 in vertebrate cells causes centrosome detachment and results in HSET depletion at centrosomes, a phenotype also observed in CEP215-deficient patient-derived cells. Moreover, in cancer cells with centrosome amplification, the CEP215-HSET complex promotes the clustering of extra centrosomes into pseudo-bipolar spindles, thereby ensuring viable cell division. Therefore, stabilization of the centrosome-spindle pole interface by the CEP215-HSET complex could promote survival of cancer cells containing supernumerary centrosomes.


Figures

Figure 1
Figure 1. Protein interaction network of CEP215.
(a) Schematic representation of the workflow used to identify interacting partners of CEP215. (b) The interactome map was constructed based on the mass spectrometric analysis of affinity-purified TAP-CEP215-containing protein complexes. GsTAP tag consists of protein G and streptavidin-binding protein. Each node represents a binding partner of CEP215 identified in all three biological replicates, but absent in WT cells and detected by a minimum of four unique peptides in at least two replicates (Supplementary Table 1). Actual or predicted subcellular localization of proteins are colour coded. The greater a Mascot score (best of three replicates), the darker the corresponding line. Dashed line for CEP152 refers to protein being found only in two experiments. Blue dashed lines mark previously reported binding between interactors of CEP215. (c) Whole-cell extracts (WCE) of WT or TAP-CEP215 cells were subjected to affinity purification (Elu) and immunoblotted with the indicated antibodies. DIC, dynein intermediate chain; MT, microtubule.
Figure 2
Figure 2. CEP215 and HSET interact through vertebrate-specific binding domains.
(a) Left panel depicts the workflow for separation of TAP-CEP215-bound complexes on a 5–40% sucrose gradient. Western blots of sucrose fractions probed with antibodies as indicated. (b) Whole-cell extracts (WCE) of HeLa cells expressing FLAG-tagged CEP215 fragments were subjected to FLAG pull-down followed by western blotting with the indicated antibodies. (c) WCE of CEP215-depleted HeLa cells expressing Bioease-tagged CEP215 fragments as indicated were subjected to streptavidin (strep) pull-down followed by western blotting with the indicated antibodies. (d) WCE of HeLa cells expressing Bioease-tagged HSET fragments were subjected to streptavidin (strep) pull-down followed by western blotting with the indicated antibodies. (e) HSET and CEP215 bind directly. Graph depicts qualitative analysis of binding between MBP-tagged CEP215 fragments (substrates) and GST-tagged HSET fragments (ligands) using surface plasmon resonance plotted as relative response units. GST and MBP proteins were used as controls. MBP shows background response for each analyte. Values for three technical replicates are shown. Error bars correspond to standard deviation. (f) Sequences of HBR of CEP215 and aa1–150 of HSET have been analysed across 97 organisms (Supplementary Fig. 2d). Dark grey cells indicate high sequence conservation within HBR of CEP215 and aa1–150 of HSET. Light grey cells depict lesser conservation of aa1–150 of HSET. Compared with human HSET aa1–150, invertebrates showed an average sequence identity of 12% in contrast to 54% among vertebrates. White cells depict the absence of HBR in CEP215 orthologues. Numbers in parentheses represent the number of organisms per class for which CEP215 and/or HSET sequences are available. (g) WCE of mitotic HeLa cells were subjected to immunoprecipitation by an anti-CEP215 antibody or random IgG (con) followed by western blotting with the indicated antibodies. (h) WCE of Drosophila Dmel2 cells were subjected to immunoprecipitation by an anti-centrosomin (Cnn) antibody followed by western blotting with the indicated antibodies.
Figure 3
Figure 3. HSET binding by CEP215 is required for association between centrosomes and spindle poles.
(a) Whole-cell extracts (WCE) of wild-type (WT) DT40, heterozygous and homozygous clones of HSETKO are immunoblotted with an anti-HSET antibody recognizing aa300–673. (b) Immunofluorescence images show WT and HSETKO1 cells stained for HSET (red) and α-tubulin (green). DNA is in blue. Scale bar, 3 μm. (c) Schematics of expected truncations are shown on top. Note that an N-terminally truncated product may be expressed in CEP215ΔN. At the bottom, WCE of WT and homozygous clones of CEP215ΔHBR and CEP215ΔN are immunoblotted with an N-terminal anti-CEP215 antibody. (d) Representative images show WT, CEP215ΔHBR and CEP215ΔN cells stained for CEP215 (red) and α-tubulin (green). DNA is in blue. Scale bar, 4 μm (e) WCE of WT and CEP215 ΔHBR cells were subjected to immunoprecipitation (IP) by an anti-CEP215 antibody or random IgG (con) followed by western blotting. Antibodies for immunoblotting are indicated. CEP215ΔHBR does not interact with HSET. (f) Representative images illustrate mitotic phenotypes in CEP215ΔN, CEP215ΔHBR and HSETKO cells stained for centrin-2 (red) and α-tubulin (green). DNA is in blue. Arrows indicate completely or partially detached centrosomes. Bottom panel shows collapsed spindle in HSETKO. Scale bar, 4 μm. (g) Graph depicts quantification of phenotypes as percentage of total mitotic cells in two independent clones of CEP215ΔHBR, CEP215ΔN and HSETKO cells (>500 mitotic cells per clone). (h) Table summarizes mitotic phenotypes of CEP215ΔN and HSETKO cells from time-lapse experiments. (i) WCE from HSETKO2 cells stably transfected with GFP-tagged wild-type HSET (HSETKO2-HSET) or mutant HSETN593K (HSETKO2-HSETN593K) were subjected to western blotting with the indicated antibodies. Graph on right depicts quantification of phenotypes as percentage of total mitotic cells (colours as in g). P values were obtained by Fisher's exact test. In the graph P values are shown for the detachment phenotype. P values for the second clones: HSETKO versus HSETKO+HSET#2: P=1.02 × 10−69; HSETKO versus HSETKO+HSET(N593K)#2: P=1.03 × 10−43; HSETKO+HSET#2 versus HSETKO+HSET(N593K)#2: 2.77 × 10⁻⁶. P values for disorganized spindle are shown in the text.
Figure 4
Figure 4. CEP215 promotes association of HSET with centrosomes.
(a) Images show WT and CEP215ΔHBR cells in which microtubules were depolymerized by nocodazole. Cells are stained for HSET (green) and γ-tubulin (red). Dot plots on right depict the volume of centrosomes (that is, measured as the volume of γ-tubulin-positive structures) and the mean signal intensity of HSET in centrosomes. Note that each dot represents a cell; centrosome volumes and mean HSET intensities were averaged across the two centrosomes in each cell (WT: n=40; CEP215ΔHBR: n=39). P values are obtained by Fisher's test. Scale bar, 3 μm. (b) Representative western blots of centrosomes isolated from WT and CEP215ΔHBR cells. Western blot on top shows cell lysates before and after centrifugation onto a 50% sucrose cushion to enrich for centrosomes (CE and inp, respectively). This input (inp) was further centrifuged through a discontinuous sucrose gradient (% sucrose is indicated above blots) with results shown on western blots below. Frame depicts centrin-rich fractions corresponding to centrosomes. Antibodies for immunoblotting are indicated. Note reduction of HSET in CEP215ΔHBR centrosomes. Graph below shows quantification of the HSET to centrin-1 signal ratio in centrin-rich fractions; n=3 biological replicates. Error bars correspond to standard deviation. (c) WT and STILKO cells in top panels are stained for HSET (green) and α-tubulin (red), and in bottom panels for CEP215 (green) and γ-tubulin (red). DNA is in blue. Scale bar, 4 μm. (d) WCE of WT and STILKO cells were subjected to immunoprecipitation (IP) by random IgG (con) or anti-CEP215 antibody, followed by western blotting using indicated antibodies.
Figure 5
Figure 5. HBR of CEP215 mediates HSET binding exclusively, whereas its CM1 domain is responsible for multiple interactions.
(a) Table depicts summary of TAP-tagged cell lines. The panel below shows the expression of protein products from CEP215-TAP, CEP215ΔHBR-TAP and CEP215ΔCM1-TAP cell lines. (b) CEP215-containing protein complexes were affinity purified from CEP215-TAP, CEP215ΔHBR-TAP and CEP215ΔCM1-TAP cells, followed by western blotting for indicated antibodies. (c) Binding of MBP-CEP215 (1–300) to microtubules was assayed using microtubule spin-down in the presence of tubulin (−taxol) or taxol-stabilized (+taxol) microtubules. MBP served as a negative control. Following centrifugation supernatants (S) and pellets (P) were loaded on gel and stained with Coomassie blue. (d) Microtubule spin-down assays were performed from lysates of CEP215-TAP, CEP215ΔHBR-TAP and CEP215ΔCM1-TAP cells in the presence of tubulin (−taxol) or taxol-stabilized microtubules (+taxol). Following centrifugation supernatants (S) and pellets (P) were subjected to western blotting. Antibodies for immunoblotting are indicated. Arrowhead marks the panel depicting the reduction of CEP215(ΔCM1)-TAP binding to microtubules. (e) Pericentrosomal CEP215 particles are visualized in DMSO- and MG132-treated WT, CEP215ΔHBR and CEP215ΔCM1 cells. Cells were stained for CEP215 (green) and γ-tubulin (red). DNA is in blue. Arrow highlights a particle. Insets show higher magnification of CEP215 and γ-tubulin stainings corresponding to framed areas. Scale bar, 4 μm. (f) Graphs show quantitation of pericentrosomal CEP215 particles as percentage of mitotic cells in the presence of DMSO or MG132. P values of paired t-tests (*P<0.05, **P<0.005); n=3 biological replicates. Error bars correspond to standard deviation. (g) DMSO- and MG132-treated WT cells were stained for CEP215 (green) and HSET (red). DNA is in blue. Scale bar, 4 μm. Insets show higher magnification of CEP215 and HSET stainings corresponding to framed areas. Note co-localization of the two proteins on pericentrosomal particles.
Figure 6
Figure 6. Centrosomes from CEP215 mutant patient cells contain reduced levels of HSET and show mild displacement from spindle poles.
(a) Whole-cell extracts were prepared from CEP215+/− and CEP215−/− human B lymphocytes followed by western blotting with the indicated antibodies. CEP215 was detected by an antibody against aa900–950. (b) Representative western blots of centrosomes isolated from CEP215+/− and CEP215−/− human B lymphocytes. Cell lysates were enriched for centrosomes by centrifugation onto a 50% sucrose cushion (inp) followed by centrifugation through a discontinuous sucrose gradient (% sucrose is indicated above blots). Antibodies for immunoblotting are indicated. (c) CEP215+/− and CEP215−/− human lymphocytes were sequentially stained for α-tubulin (green) and γ-tubulin (red). Spindle axis (marked as white dotted line) was determined using automated image analysis (see Methods for details). Position of centrosomes with respect to the axis was determined manually as depicted in schematics and data is shown in a bar chart. Arrow points to a centrosome positioned over 30° from spindle axis. P values were obtained by Fisher's exact test for n=100 cells. Scale bar, 3 μm. (d) Images show CEP215+/− and CEP215−/−human lymphocytes stained for the centrosomal protein CEP63 (red) and α-tubulin (green). Dot plot depicts distribution of distance between centrosomes and corresponding spindle poles (CEP215+/−: n=42 and CEP215−/−: n=44 cells). P values are obtained by Wilcoxon-rank sum test. Scale bar=3 μm.
Figure 7
Figure 7. CEP215 facilitates centrosome clustering in mouse neuroblastoma cells via its HBR domain.
(a) Western blots of whole-cell extracts of N1E-115 cells untreated (unt) or transfected with HSET siRNA (siHSET), retroviral control shRNA (shCon) or CEP215 shRNA (shCEP215) with the indicated antibodies. (b) Images show siRNA/shRNA-treated N1E-115 cells stained for centrin-2 (red) and α-tubulin (green)) Scale bar, 8 μm. (c) Experimental timeline is shown in schematic. Still frames from time-lapse experiments depict mitosis in untreated (unt) or siRNA/shRNA-treated N1E-115 cells. Graph below shows percentage of mitotic cells with multipolar anaphases from time-lapse experiments. Total number of mitoses analysed per treatment is shown. Two-way ANOVA followed by Tukey's test were performed (**P<0.005); n=3 biological replicates. Error bars correspond to standard deviation. (d) Graph depicts viability of untreated (unt) or siRNA/shRNA-treated N1E-115 cells as a function of relative light units (RLU) using CellTiter-Glo assay. P values of paired t-tests (**P<0.005); n=3 biological replicates. (e) N1E-115 cells stably expressing Flag, Flag-CEP215 or Flag-CEP215(ΔHBR) were transduced with a control (shCon) or CEP215 shRNA (shCEP215) and 72 h later immunoblotted for indicated antibodies. Both low and high exposures of the blot are presented. (f) Images show N1E-115 cells stably expressing Flag, Flag-CEP215 or Flag-CEP215(ΔHBR) stained for FLAG (green) and α-tubulin (red). DNA is in blue. Scale bar, 8 μm. (g) Parental N1E-115 cells or those stably expressing Flag, Flag-CEP215 or Flag-CEP215(ΔHBR) were transduced with control (shCon) or CEP215 shRNA (shCEP215) and followed live with same timeline as in panel c. Graph shows the percentage of mitotic cells with multipolar anaphases from time-lapse experiments. Total number of mitoses analysed per treatment is shown. Two-way ANOVA followed by Tukey's test were performed (**P<0.005); n=4 biological replicates. Error bars correspond to s.d.
Figure 8
Figure 8. CEP215 and HSET promote centrosome association with mitotic spindle poles and centrosome clustering in human breast cancer cells.
(a) Western blots of whole-cell extracts of BT-549 cells prepared 72 h after siRNA transfections. Untreated (unt) cells are included as controls. Antibodies for immunoblotting are indicated. (b) Still frames from a time-lapse experiment show mitosis in BT-549 cells untreated (unt) or treated with control (siCon), CEP215 (siCEP215) or HSET (siHSET) siRNAs. Graph depicts the number of multipolar anaphases in cells treated with the indicated siRNAs. Total number of mitoses analysed per treatment is shown. (c) Graph shows viability of untreated (unt) or siRNA-treated BT-549 cells as a function of relative light units (RLU) using CellTiter-Glo assay. n=3 biological replicates, where error bars denote standard deviation and statistical significance was computed using paired t-test. (d) Images of siRNA-treated BT-549 cells stained for the centriolar marker CPAP (green) and α-tubulin (red). DNA is in blue. Arrows mark detached centrosomes. Scale bar, 6 μm. (e) Graphs show quantifications of centrosome and spindle phenotypes (as depicted in schematics) in siRNA-treated BT-549 cells. Two-way ANOVA followed by Tukey's test were performed (*P<0.05, **P<0.005); n=3 biological replicates. Error bars correspond to standard deviation. (f) Schematic representation of the proposed function of CEP215 at the centrosome–spindle pole interface. Briefly, through HBR CEP215 captures HSET- bound minus ends of k-fibres and interpolar microtubules, thereby anchoring these at the centrosome. CEP215 may also capture dynein-associated microtubules through the CM1 domain.

References

    1. Heald R., Tournebize R., Habermann A., Karsenti E. & Hyman A. Spindle assembly in Xenopus egg extracts: respective roles of centrosomes and microtubule self-organization. J. Cell Biol. 138, 615–628 (1997). - PMC - PubMed
    1. Nigg E. A. & Stearns T. The centrosome cycle: centriole biogenesis, duplication and inherent asymmetries. Nat. Cell Biol. 13, 1154–1160 (2011). - PMC - PubMed
    1. Gonczy P. Towards a molecular architecture of centriole assembly. Nat. Rev. Mol. Cell Biol. 13, 425–435 (2012). - PubMed
    1. Chavali P. L., Peset I. & Gergely F. Centrosomes and mitotic spindle poles: a recent liaison? Biochem. Soc. Trans. 43, 13–18 (2015). - PubMed
    1. Khodjakov A., Cole R. W., Oakley B. R. & Rieder C. L. Centrosome-independent mitotic spindle formation in vertebrates. Curr. Biol. 10, 59–67 (2000). - PubMed

Publication types

MeSH terms