. 2016 May 6;291(19):10263-76.
doi: 10.1074/jbc.M115.695825. Epub 2016 Mar 17.

Loss of Mitochondrial Function Impairs Lysosomes

Affiliations

Loss of Mitochondrial Function Impairs Lysosomes

Julie Demers-Lamarche et al. J Biol Chem. .

Abstract

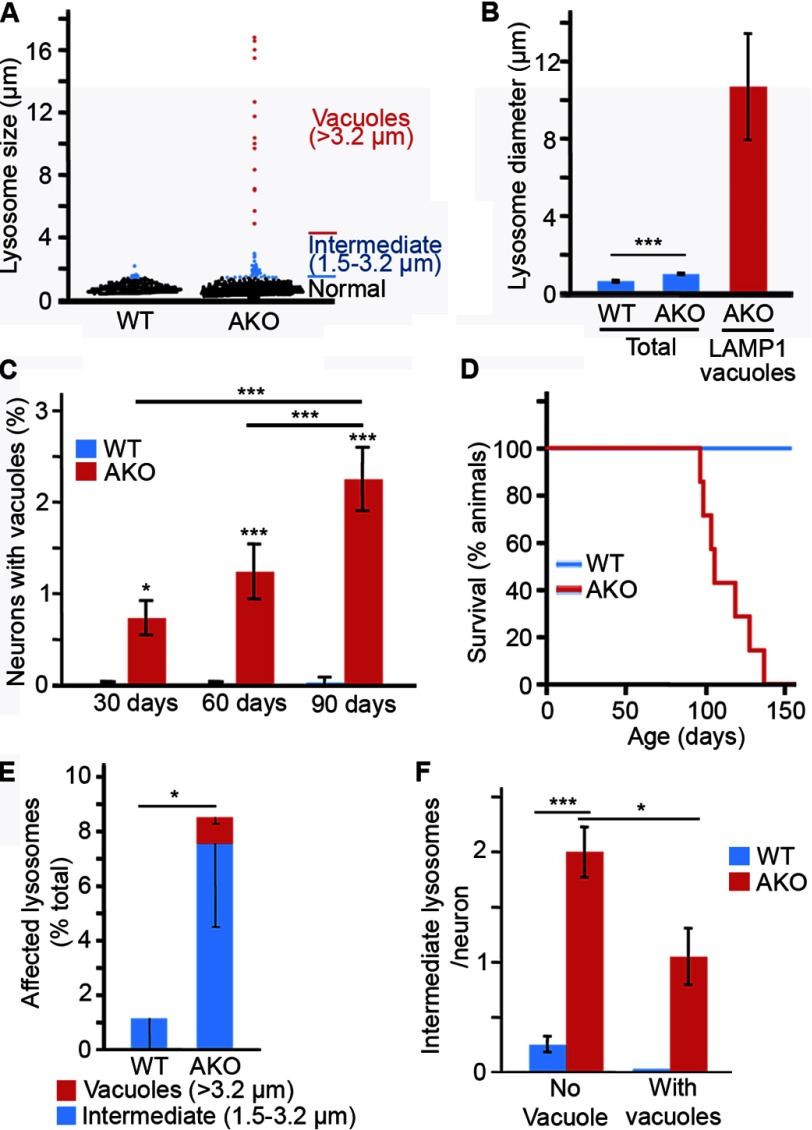
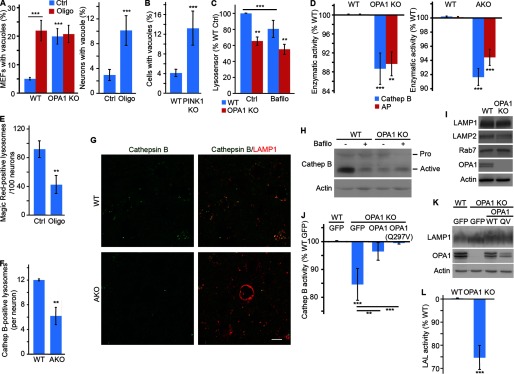
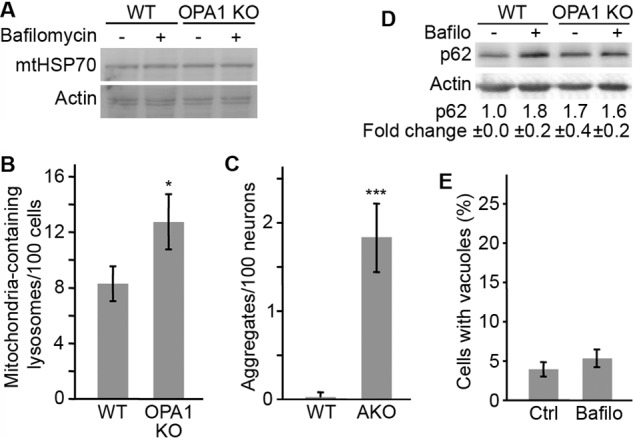
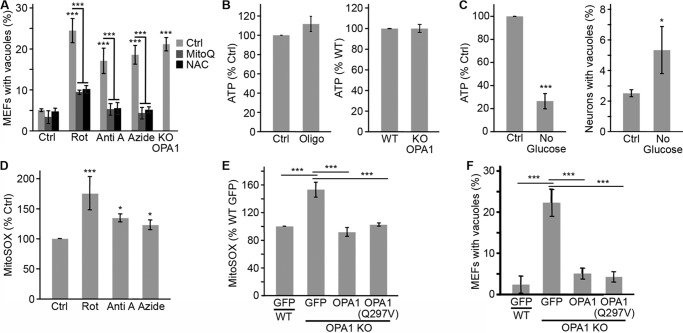
Alterations in mitochondrial function, as observed in neurodegenerative diseases, lead to disrupted energy metabolism and production of damaging reactive oxygen species. Here, we demonstrate that mitochondrial dysfunction also disrupts the structure and function of lysosomes, the main degradation and recycling organelle. Specifically, inhibition of mitochondrial function, following deletion of the mitochondrial protein AIF, OPA1, or PINK1, as well as chemical inhibition of the electron transport chain, impaired lysosomal activity and caused the appearance of large lysosomal vacuoles. Importantly, our results show that lysosomal impairment is dependent on reactive oxygen species. Given that alterations in both mitochondrial function and lysosomal activity are key features of neurodegenerative diseases, this work provides important insights into the etiology of neurodegenerative diseases.

Keywords: Parkin; lysosome; mitochondria; neurodegenerative disease; reactive oxygen species (ROS).


Figures

FIGURE 1.
FIGURE 1.
Deletion of the mitochondrial protein AIF disrupts lysosomal morphology in cortical neurons. A, cortical sections of 90-day-old WT and AKO animals were stained for mitochondria (TOM20; green) and lysosomes (LAMP1; red). B, alternatively, complex I (NDUFA9) and the mitochondrial chaperone mtHSP70 were analyzed by Western blot (B). C and D, large LAMP1-positive vacuoles (red), excluding the cytosolic markers NeuN (C, green) and SOD1 (D, green) are present in the cortex of 90-day-old AKO mice. E and F, LAMP1 vacuoles are present in layer V neurons. Vacuoles were observed as a region within a neuron excluding NeuN (E, green). Laver V neurons were identified as Oct6-positive neurons (E, red). Large LAMP1-positive structures (red) can also be observed in layer V in composite images of the complete cortex reconstituted from several images taken using a ×40 objective (F; neuronal marker NeuN in green). G, the presence of LAMP1 vacuoles (LAMP1; red) does not affect nuclear morphology (Hoechst; green). The image was generated in ImageJ from a z-stack acquired using a ×63 objective. H, LAMP1 expression is not affected in the cortex of 90-day-old AKO mice. Representative images are shown for all panels, with an asterisk denoting vacuoles; scale bar, 10 μm.
FIGURE 2.
FIGURE 2.
Deletion of the mitochondrial protein AIF disrupts lysosomal size distribution in cortical neurons. A, size distribution of lysosomes in cortical neurons from 90-day-old WT and AKO animals. LAMP1-positive lysosomes were measured in 3 animals/genotype using ImageJ. B, average diameter of the entire LAMP1-positive population (blue) and LAMP1-positive vacuoles (red) measured in A. Data are expressed as the average ± S.E. (error bars). n = 506 WT lysosomes, n = 606 AKO lysosomes, and n = 15 AKO LAMP1 vacuoles, all measured from at least 3 animals/genotype. C and D, the number of neurons containing LAMP1 vacuoles increases over time in AKO mice. The number of layer V neurons containing LAMP1 vacuoles was quantified in 3 animals/genotype ± S.D. for each time point (C). AKO mice died shortly after the last time point (90 days) (D). Median age of death for males was 105 days; n = 7. E, LAMP1-positive lysosomes were binned as normal (diameter <1.5 μm), intermediate (between 1.5 and 3.2 μm), or vacuole (>3.2 μm). The number of lysosomes per bin was determined for each animal, and data are expressed as percentage of lysosomes ± S.D. (error bars) for 3 animals/genotype. (total of intermediate lysosomes and LAMP1 vacuoles). F, lysosome size was analyzed in each neuron (at least 26 neurons/animal), according to the presence or absence of a lysosomal vacuole (>3.2-μm diameter) and expressed as the number of intermediate lysosomes (between 1.5 and 3.2 μm)/neuron ± S.D., 3 animals/genotype. *, p < 0.05; **, p < 0.01; ***, p < 0.001.
FIGURE 3.
FIGURE 3.
LAMP1 vacuoles have endolysosomal features. A, the signal for the lysosomal marker LAMP1 (red) and the endosomal/lysosomal marker Rab7 (green) only partially colocalize within LAMP1 vacuoles in OPA1 KO MEFs. The right panels show an enlargement of the boxed section in the image on the left. B, LAMP1-positive vesicles accumulate within LAMP1 vacuoles (red) in 90-day-old AKO neurons. C, EM images of the vacuoles in OPA1 KO MEFs. D, OPA1 KO MEFs were transfected with RFP-LAMP1 (red) and incubated in the presence of the lysosomal pH-sensitive dye Lysosensor (green), and live cell images were acquired. E–G, WT and OPA1 KO MEFs were incubated for 1 h in the presence of Texas Red-conjugated dextran and chased in DMEM for the indicated times. Colocalization between dextran and LAMP1 was determined in normal lysosomes (E) and LAMP1 vacuoles (G, left). Data are expressed as the average of three experiments ± S.D. (error bars). ***, p = 2E−6. F, representative images of dextran-filled (middle) and dextran-associated (right) vacuoles. The number of dextran-filled vacuoles was also quantified in primary neurons treated for 4 h with oligomycin in the presence of dextran (G, right). Scale bar, 10 μm except for in C (left (1 μm) and right (400 nm)).
FIGURE 4.
FIGURE 4.
Mitochondrial dysfunction impairs lysosomal activity. A and B, LAMP1 vacuoles are present in cellular models of mitochondrial dysfunction. Mitochondrial function was disrupted in MEFs and primary cortical neurons by inhibiting the ATP synthase with oligomycin. Alternatively, the mitochondrial protein OPA1 (A) or PINK1 (B) was disrupted in MEFs. The number of cells with LAMP1 vacuoles (diameter >3.0 μm) was then quantified and expressed as the average of three (OPA1 KO) or four (neurons, PINK1 MEFs) experiments ± S.D. (error bars). C, quantification of Lysosensor signal by FACS. Fluorescence was normalized to WT control (Ctrl) for three experiments ± S.D. D, lysosomal activity was measured in extracts from WT and OPA1 KO MEFs incubated in the presence of cathepsin B or acid phosphatase (AP) substrates. Fluorescence was normalized to WT MEFs and expressed as the average of three (acid phosphatase; AP) or five (cathepsin B) experiments ± S.D. Alternatively, lysosomal activity was measured in cortical extracts from 105-day-old WT and AKO (right). Data are expressed as the average of 3 animals/genotype ± S.D. E, decreased cathepsin B activity in oligomycin-treated primary neurons. Neurons were treated with oligomycin, and the cathepsin B substrate Magic Red-RR was added for the last 30 min of the treatment. Lysosomes were then stained with LAMP1, and the number of Magic Red-positive lysosomes was quantified by immunofluorescence. Data are expressed as the average of three experiments ± S.D. F and G, decreased cathepsin B expression in AKO brains. 90-day-old WT and AKO animals were stained for cathepsin B (green in G) and lysosomes (LAMP1; red in G). Quantification of 3 animals/genotype ± S.D. is shown in F. Representative images are shown; scale bar, 10 μm. H, expression level of cathepsin B in WT and OPA1 KO MEFs in the absence or in the presence of the lysosomal inhibitor bafilomycin. I, the expression of lysosomal structural proteins is not affected by the deletion of OPA1. J, cathepsin B activity was measured in extracts from WT and OPA1 KO MEFs stably expressing the indicated constructs. Data are expressed as the average of four experiments ± S.D. OPA1 and LAMP1 expression levels in the reconstituted cells are shown in K. L, extracts from WT and OPA1 KO MEFs were incubated in the presence of lysosomal acid lipase (AP) substrates, and fluorescence was measured. Data were normalized to WT MEFs and expressed as the average of five experiments ± S.D. *, p < 0.05; **, p < 0.01; ***, p < 0.001.
FIGURE 5.
FIGURE 5.
Mitochondrial dysfunction impairs the degradation of lysosomal substrates. A, levels of the mitochondrial protein mtHSP70 were analyzed in WT and OPA1 KO MEFs in the absence or the presence of bafilomycin. B, the number of mtHSP70-containing LAMP1-positive lysosomes was quantified by immunofluorescence. C, the presence of large autofluorescent aggregates was quantified in 90-day-old WT and AKO animals and expressed as the average number of aggregates/neuron ± S.D. (error bars). D, levels of the autophagy proteins p62 were quantified by Western blot in WT and OPA1 KO MEFs in the absence or the presence of bafilomycin. The results were quantified using ImageJ and expressed as an average of three independent experiments ± S.D. E, WT MEFs were treated with bafilomycin, and vacuole formation was measured as in Fig. 4A. Data are expressed as the average of three experiments ± S.D. *, p < 0.05; ***, p < 0.001.
FIGURE 6.
FIGURE 6.
LAMP1 vacuole formation depends on the loss of mitochondrial function but not total ATP levels. A, WT MEFs were treated with the complex I inhibitor rotenone (Rot), the complex III inhibitor antimycin A (Anti A), or the complex IV inhibitor sodium azide (Azide), and LAMP1 vacuoles were quantified in the absence or the presence of the antioxidant MitoQ or NAC. OPA1 KO MEFs were included as a positive control. Data are expressed as the average of four experiments ± S.D. (error bars). B, ATP levels are not altered in OPA1 KO MEFs or WT MEFs treated with 10 μm oligomycin. ATP levels were normalized to WT (right) or control (left) levels and expressed as the average of three experiments ± S.D. C, primary neurons were incubated in glucose-free media for 4 h, after which ATP levels and LAMP1 vacuole content were measured. Data are expressed as the average of four experiments ± S.D. D and E, ROS levels were measured using MitoSOX following ETC inhibition (D; compounds as in A) or in OPA1 KO MEFs stably expressing the indicated constructs (E). Data are expressed as the average of four experiments ± S.D. F, OPA1 KO lysosomal morphology is rescued by reintroducing WT OPA1 or the fusion-defective mutant OPA1(Q297V). Data are expressed as the average of three experiments ± S.D. Expression of the OPA1 constructs is shown in Fig. 4K. *, p < 0.05; ***, p < 0.001.
FIGURE 7.
FIGURE 7.
Quenching ROS rescues lysosomal defects following mitochondrial dysfunction. A and B, the increased ROS levels present in OPA1 KO MEFs are reduced by the antioxidants NAC (A), Q10, and the mitochondria-targeted form of Q10 (MitoQ) (B). Data are expressed as the average of four experiments ± S.D. (error bars) (n = 3 for NAC). C–E, antioxidants prevent LAMP1 vacuole formation. Vacuoles were quantified as in Fig. 4A, and the data are expressed as the average of three experiments ± S.D. (n = 4 for NAC). F–H, ROS were measured in myxothiazol-treated WT and OPA1 KO MEFs using MitoSOX (F). LAMP1 vacuole formation was then quantified in WT and OPA1 KO MEFs (G) as well as in GFP-Parkin-expressing U2OS cells in the absence or the presence of the antioxidants MitoQ and NAC (H). Data are expressed as the average of four experiments (MEFs) and three experiments (U2OS) ± S.D. *, p < 0.05; **, p < 0.01; ***, p < 0.001.
FIGURE 8.
FIGURE 8.
Vacuole formation requires mitochondrial damage downstream of ROS. A and B, WT and OPA1 KO MEFs were treated with the SOD1 inhibitor DDC, and ROS levels were measured with MitoSOX. LAMP1 vacuoles were then measured and expressed as the average of three experiments ± S.D. (error bars). C, WT MEFs were treated for 1 h with glucose oxidase (GO). Vacuoles were then quantified and expressed as the average of three experiments ± S.D. D and E, U2OS cells stably expressing GFP-Parkin were treated as indicated, fixed, and stained for the mitochondrial markers mtHSP70 (green) and TOM20 (red) as well as GFP-Parkin (blue). GFP-Parkin MDV and mtHSP70-positive TOM20-negative MDV were quantified. At least 70 cells were quantified within three independent experiments, and the data are expressed as the number of MDVs/cell ± S.E. (error bars). Alternatively, the number of LAMP1 vacuoles containing Parkin-positive MDVs was quantified and expressed as the average of four experiments ± S.D. F, representative images are shown in D. Scale bar, 2 μm. F and G, U2OS cells stably expressing GFP-Parkin were treated with the complex III inhibitor antimycin A or the ATP synthase inhibitor oligomycin. Recruitment of GFP-Parkin (blue in G (top)) to LAMP1 vacuoles (red in G (top)) and TOM20-positive mitochondria (green in G (top)) was then analyzed by immunofluorescence. The number of vacuoles containing Parkin-positive MDVs was quantified in F and expressed as the average of four experiments ± S.D. H and I, oligomycin causes LAMP1 vacuole formation despite minimal Parkin-positive MDV production. H, GFP-Parkin-positive MDVs were quantified from a minimum of 100 cells within three independent experiments and expressed as the number of MDVs/cell ± S.D. Alternatively, LAMP1 vacuoles were quantified and expressed as the average of three independent experiments ± S.D. I, *, p < 0.05; **, p < 0.01; ***, p < 0.001.
FIGURE 9.
FIGURE 9.
Antioxidants rescue lysosomal function following the loss of mitochondrial function. A and B, WT and OPA1 KO MEFs were incubated in the presence of NAC (A) or Q10 or MitoQ (B), and lysosomal pH was measured using Lysosensor. Data are expressed as the average of three experiments (NAC) or four experiments (Q10 and MitoQ) ± S.D. (error bars). C–E, WT and OPA1 KO MEFs were incubated in the presence of NAC (C), Q10 (D), or MitoQ (E). In vitro cathepsin B activity was then measured and expressed as the average of five (NAC), four (Q10, antimycin A), or three (MitoQ) experiments ± S.D. F, cells were treated with the ROS-generating complex III inhibitor antimycin A (Anti A) or myxothiazol (Myxo), which inhibits complex III without generating ROS. In vitro cathepsin B activity was then measured and expressed as the average of four experiments ± S.D. G and H, NAM rescues NAD/NADH ratio but not lysosomal activity in OPA1 KO MEFs. NAD/NADH ratio and cathepsin B activity were measured in WT and OPA1 KO MEFs following a 2-day treatment with NAM. Results are expressed as the average of three experiments ± S.D. *, p < 0.05; **, p < 0.01; ***, p < 0.001.

References

    1. Ben-Gedalya T., and Cohen E. (2012) Quality control compartments coming of age. Traffic 13, 635–642 - PubMed
    1. Tai H. C., and Schuman E. M. (2008) Ubiquitin, the proteasome and protein degradation in neuronal function and dysfunction. Nat. Rev. Neurosci. 9, 826–838 - PubMed
    1. Patten D. A., Germain M., Kelly M. A., and Slack R. S. (2010) Reactive oxygen species: stuck in the middle of neurodegeneration. J. Alzheimers Dis. 20, S357–S367 - PubMed
    1. Boya P., Reggiori F., and Codogno P. (2013) Emerging regulation and functions of autophagy. Nat. Cell Biol. 15, 713–720 - PMC - PubMed
    1. Mizushima N., and Komatsu M. (2011) Autophagy: renovation of cells and tissues. Cell 147, 728–741 - PubMed

Publication types

MeSH terms

LinkOut - more resources