. 2016 Mar 18:16:236.
doi: 10.1186/s12885-016-2274-5.

Snail-induced epithelial-to-mesenchymal transition of MCF-7 breast cancer cells: systems analysis of molecular changes and their effect on radiation and drug sensitivity

Affiliations

Snail-induced epithelial-to-mesenchymal transition of MCF-7 breast cancer cells: systems analysis of molecular changes and their effect on radiation and drug sensitivity

Roman Mezencev et al. BMC Cancer. .

Abstract

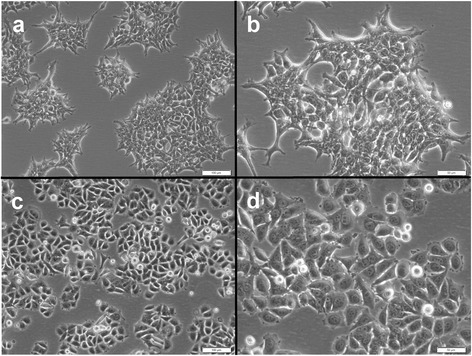
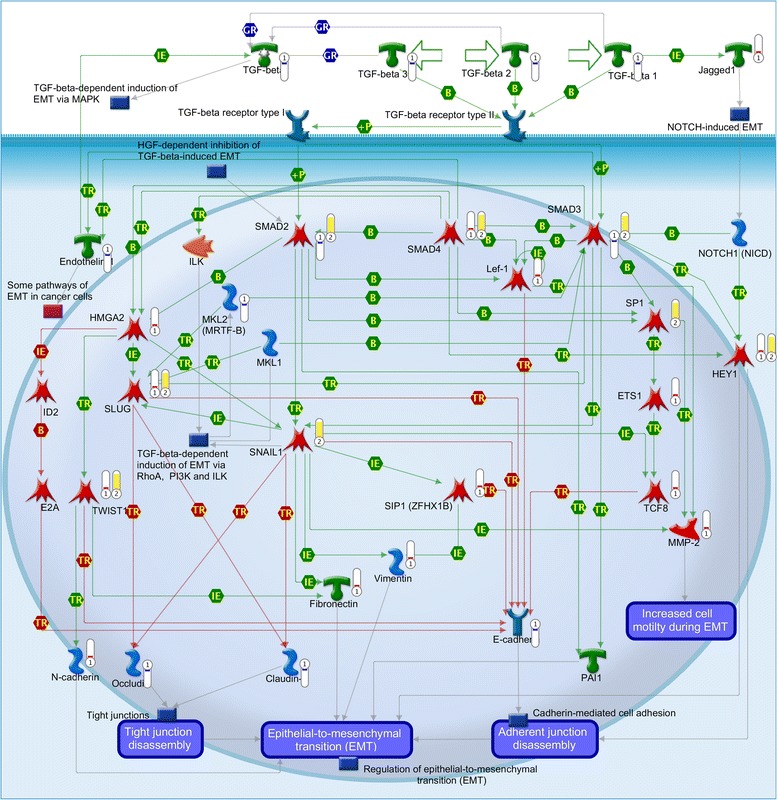
Background: Epithelial-to-mesenchymal transition (EMT) has been associated with the acquisition of metastatic potential and the resistance of cancer cells to therapeutic treatments. MCF-7 breast cancer cells engineered to constitutively express the zinc-finger transcriptional repressor gene Snail (MCF-7-Snail cells) have been previously shown to display morphological and molecular changes characteristic of EMT. We report here the results of a comprehensive systems level molecular analysis of changes in global patterns of gene expression and levels of glutathione and reactive oxygen species (ROS) in MCF-7-Snail cells and the consequence of these changes on the sensitivity of cells to radiation treatment and therapeutic drugs.

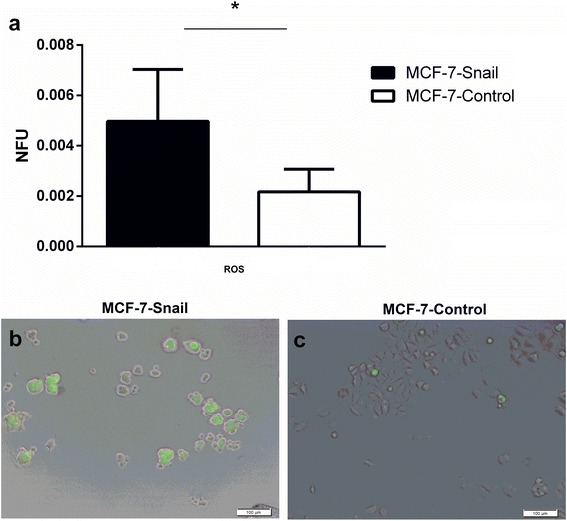
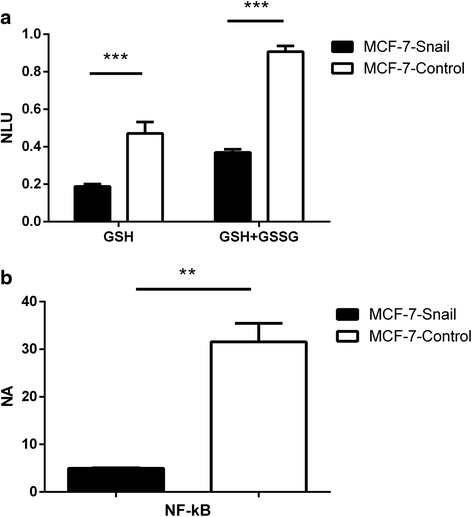
Methods: Snail-induced changes in global patterns of gene expression were identified by microarray profiling using the Affymetrix platform (U133 Plus 2.0). The resulting data were processed and analyzed by a variety of system level analytical methods. Levels of ROS and glutathione (GSH) were determined by fluorescent and luminescence assays, and nuclear levels of NF-κB protein were determined by an ELISA based method. The sensitivity of cells to ionizing radiation and anticancer drugs was determined using a resazurin-based cell cytotoxicity assay.

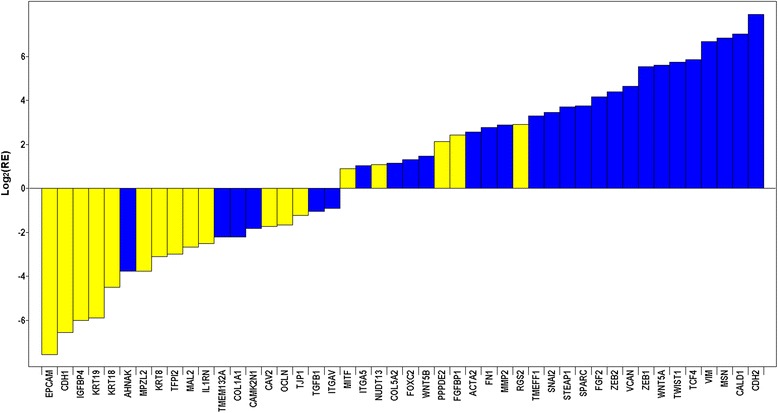
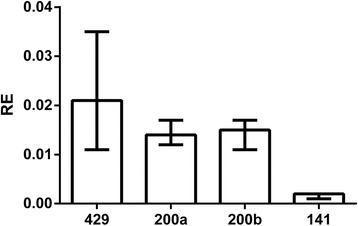
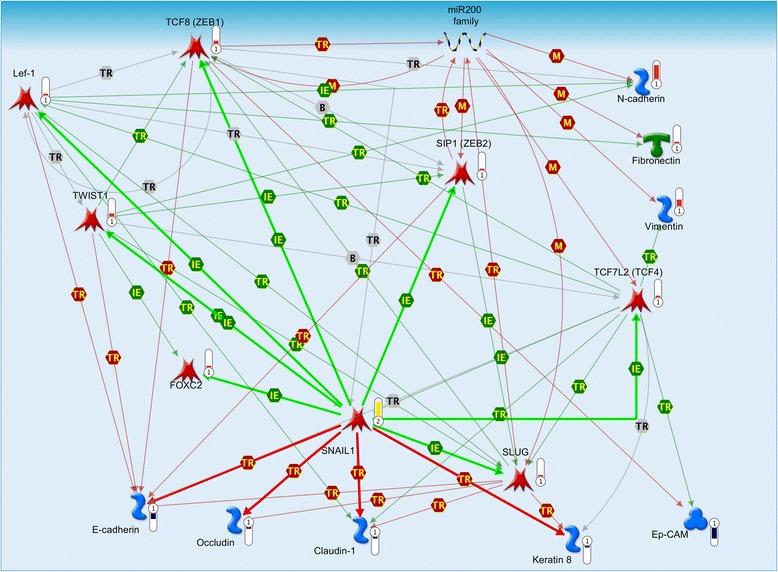
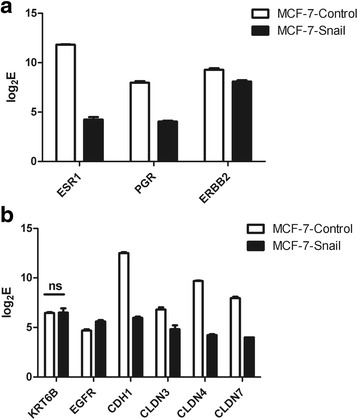
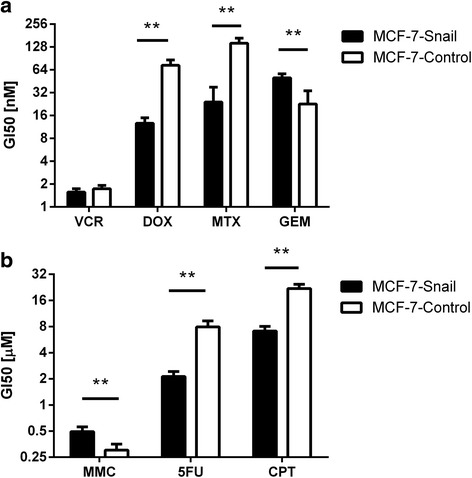
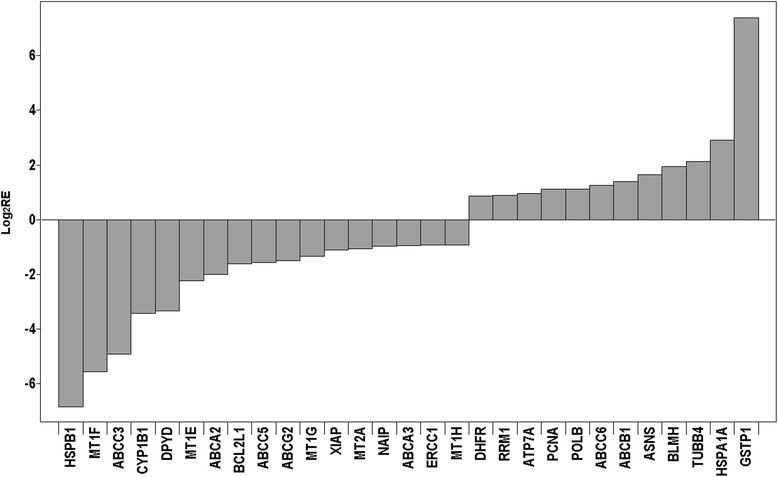
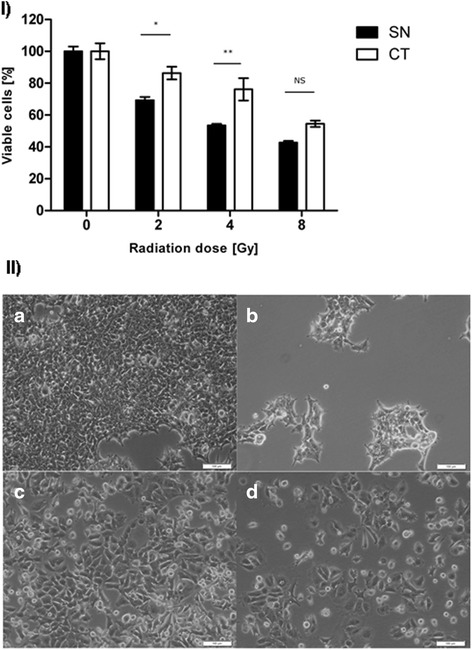
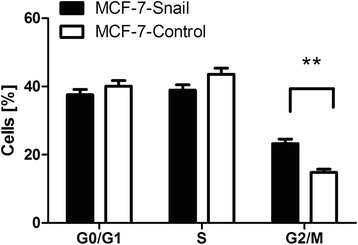
Results: Constitutive ectopic expression of Snail in epithelial-like, luminal A-type MCF-7 cells induced significant changes in the expression of >7600 genes including gene and miRNA regulators of EMT. Mesenchymal-like MCF-7-Snail cells acquired molecular profiles characteristic of triple-negative, claudin-low breast cancer cells, and displayed increased sensitivity to radiation treatment, and increased, decreased or no change in sensitivity to a variety of anticancer drugs. Elevated ROS levels in MCF-7-Snail cells were unexpectedly not positively correlated with NF-κB activity.

Conclusions: Ectopic expression of Snail in MCF-7 cells resulted in morphological and molecular changes previously associated with EMT. The results underscore the complexity and cell-type dependent nature of the EMT process and indicate that EMT is not necessarily predictive of decreased resistance to radiation and drug-based therapies.

Keywords: Drug resistance; Epithelial-to-mesenchymal transition; Glutathione; MCF-7; NF-κB; Radiation sensitivity; Reactive oxygen species; Slug; Snail; Triple-negative breast-cancer.


Figures

Fig. 1
Fig. 1
Brightfield (phase contrast) micrographs of MCF-7-Snail and MCF-7-Control cells. Shown are MCF-7-Snail (a, b) and MCF-7 Control cells (c, d). Magnification: 100× (a, c) or 200× (b, d). Scale bars: 100 μm, (a, c) and 50 μm (b, d)
Fig. 2
Fig. 2
Relative expression of a subset of the 71 EMT-related genes in MCF-7-Snail vs MCF-7-Control cells. Results shown in log2 scale (from microarray data). Color-coding: Yellow = epithelial phenotype-associated genes; blue = mesenchymal phenotype-associated genes
Fig. 3
Fig. 3
Relative expression of miRNA 200 family members in MCF-7-Snail vs MCF-7 Control cells. Relative expression (RE) determined by qPCR. Error bars: 95 % CI (N = 4 replicates). P-values from randomization test: miR-429 (p = 0.008), miR-200a (p = 0.016), miR-200b (0.022), miR-141 (p = 0.015)
Fig. 4
Fig. 4
Complex regulatory interplay among transcription factors, miRNA 200 family members and E/M-phenotype related genes. Map created from genes differentially expressed between MCF-7-Snail and MCF-7-Control cells using MapEditor (Thomson Reuters, New York, NY, USA) to connect network objects based on previously reported associations. Legend for edges: TR transcriptional regulation, IE influence on expression, M microRNA binding. Green edge – activation; red edge repression. Edges originating or ending at SNAI1 are depicted as thick lines. Thermometers: red = network object up-regulated in MCF-7-Snail cells; blue = network object down-regulated in MCF-7-Snail cells; yellow = network object identified as over-connected to the list of differentially expressed genes. For more details on legend https://portal.genego.com/legends/MetaCoreQuickReferenceGuide.pdf
Fig. 5
Fig. 5
GeneGO pathway map “Development_TGF-beta-dependent induction of EMT via SMADs” is significantly enriched for genes differentially expressed between MCF-7-Snail and MCF-7-Control cells. Thermometers: red = object up-regulated in MCF-7-Snail cells; blue = object down-regulated in MCF-7-Snail cells; yellow = network object identified as over-connected to the list of differentially expressed genes. For more details on legend see https://portal.genego.com/legends/MetaCoreQuickReferenceGuide.pdf
Fig. 6
Fig. 6
Expression of molecular markers for classification of breast cancer subtypes and for sub-typing of triple-negative breast cancers. Shown are log2E - logarithm of PLIER+16-processed expression signals of molecular markers for breast cancer subtypes (a) and for sub-typing of triple-negative breast cancers (b); ns difference between MCF-7-Snail and MCF-7-Control cells was not significant (all other markers are significantly differentially expressed between MCF-7-Snail and MCF-7-Control cells at FDR = 2.12 % and absolute fold change (FC) ≥1.5)
Fig. 7
Fig. 7
The level of ROS detected by H2DCF-DA staining in MCF-7-Snail vs MCF-7-Control cells. Levels of ROS detected by fluorimetry (a) and representative epifluorescence microscopy images overlaid on brightfield images (b: MCF-7-Snail, c: MCF-7-Control cells). NFU normalized fluorescence units, Error bars: SD; p-value = 0.0471 (two-tailed t-test); scale bar: 100 μm (*: p <0.05)
Fig. 8
Fig. 8
Levels of GSH, GSH+GSSG and nuclear NF-κB. a Levels of free (GSH) and total (GSH+GSSG) glutathione in MCF-7-Snail and MCF-7-Control cells determined by luminescent assay; NLU normalized luminescence units; p-values (multiple t-test with Holm-Šidák correction): GSH = 9.98 × 10−5; GSH+GSSG = 8.46 × 10−8. b Levels of nuclear NF-κB in MCF-7-Snail and MCF-7-Control cells expressed as determined by ELISA in nuclear protein lysates; NA normalized absorbance; Error bars: SD; p = 0.0071 (Welch’s corrected t-test; **: p <0.01; ***: p <0.001)
Fig. 9
Fig. 9
Drug sensitivity for MCF-7-Snail and MCF-7-Control cells determined by Tox-8 assay and expressed as GI50 values. a vincristine (VCR), doxorubicin (DOX), methotrexate (MTX), gemcitabine (GEM); b mitomycin C (MMC), 5-fluorouracil (5FU), cisplatin (CPT). Error bars: SD; N = 4 replicates. Statistical significance of differences between mean GI50 values determined by t-test corrected by Holm-Šidák method (**: p <0.01)
Fig. 10
Fig. 10
Relative expression of a subset of 53 drug resistance-related genes that displayed significantly different expression in MCF-7-Snail relative to MCF-7-Control cells. Relative expression from microarray data is presented in log2 scale
Fig. 11
Fig. 11
Radiation sensitivity for MCF-7-Snail and MCF-7-Control cells. I Radiation sensitivity determined from the number of viable cells 72 h post-irradiation by specified doses of X-ray. Viable cells [%] corresponds to the number of viable cells determined by Tox-8 assay in treatment relative to non-irradiated control cultures (N = 2 replicates; *: p <0.05; **: p <0.01); error bars = SD. II Micrographs of MCF-7-Snail (a, b) and MCF-7-Control cells (c, d) 72 h post-irradiation with 0 Gy (a, c) or 4 Gy (b, d). Scale bar: 100 μm. SN = MCF-7-Snail cells; CT = MCF-7-Control cells
Fig. 12
Fig. 12
Cell cycle distribution of MCF-7-Snail and MCF-7-Control cells at the time of X-ray irradiation. (means ± SEM; N = 3 replicates; **: p <0.01)

References

    1. Ferlay J, Soerjomataram I, Ervik M, Dikshit R, Eser S, Mathers C, et al. GLOBOCAN 2012 v1.0, Cancer Incidence and Mortality Worldwide: IARC CancerBase No. 11 [Internet]. 2013. http://globocan.iarc.fr. Acessed 07/01/2014.
    1. Lu J, Steeg PS, Price JE, Krishnamurthy S, Mani SA, Reuben J, et al. Breast cancer metastasis: challenges and opportunities. Cancer Res. 2009;69:4951–3. doi: 10.1158/0008-5472.CAN-09-0099. - DOI - PubMed
    1. Kennecke H, Yerushalmi R, Woods R, Cheang MCU, Voduc D, Speers CH, et al. Metastatic behavior of breast cancer subtypes. J Clin Oncol. 2010;28:3271–7. doi: 10.1200/JCO.2009.25.9820. - DOI - PubMed
    1. Bolender DL, Markwald RR. Epithelial-mesenchymal transformation in chick atrioventricular cushion morphogenesis. Scan Electron Microsc. 1979;3:313–21. - PubMed
    1. Baum B, Settleman J, Quinlan MP. Transitions between epithelial and mesenchymal states in development and disease. Semin Cell Dev Biol. 2008;19:294–308. doi: 10.1016/j.semcdb.2008.02.001. - DOI - PubMed

Publication types

MeSH terms