. 2016 Apr 19;7(16):22791-806.
doi: 10.18632/oncotarget.8061.

Loss of miR-449a in ERG-associated prostate cancer promotes the invasive phenotype by inducing SIRT1

Affiliations

Loss of miR-449a in ERG-associated prostate cancer promotes the invasive phenotype by inducing SIRT1

Parameet Kumar et al. Oncotarget. .

Abstract

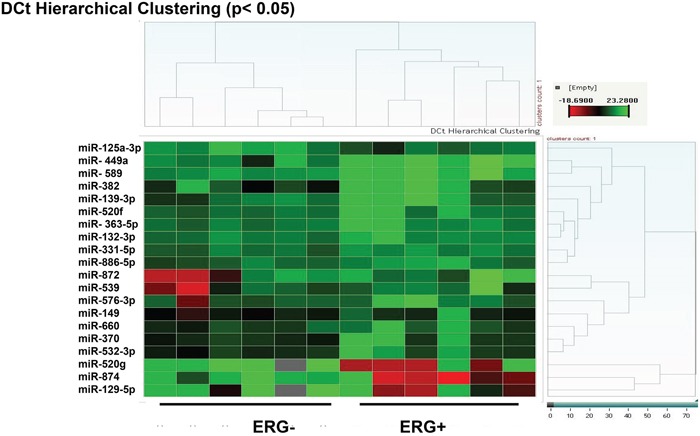
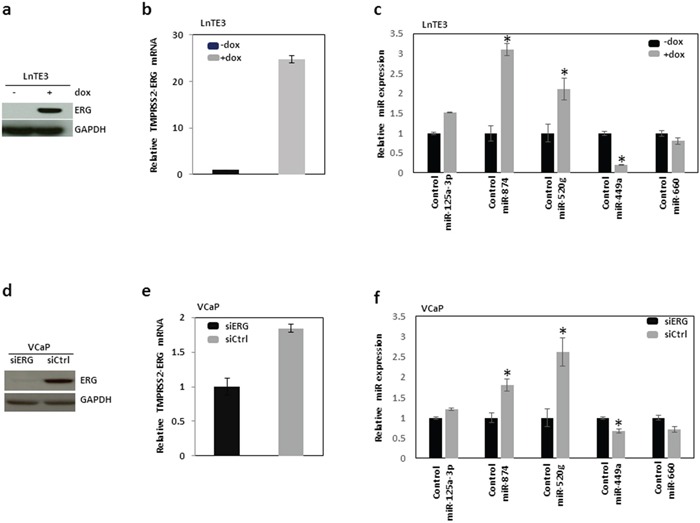
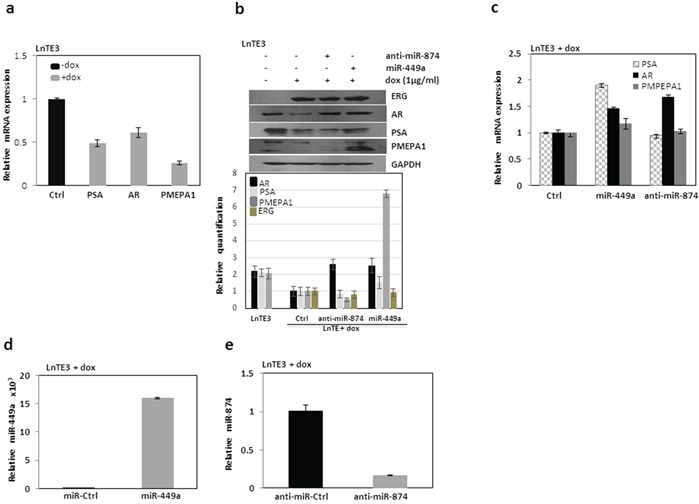
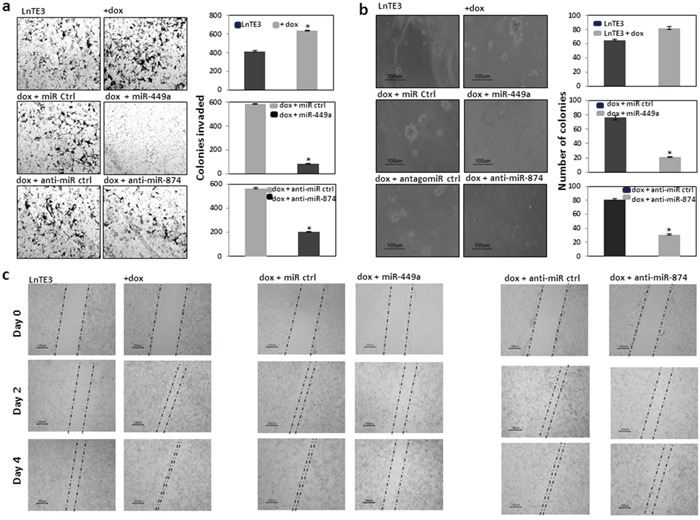
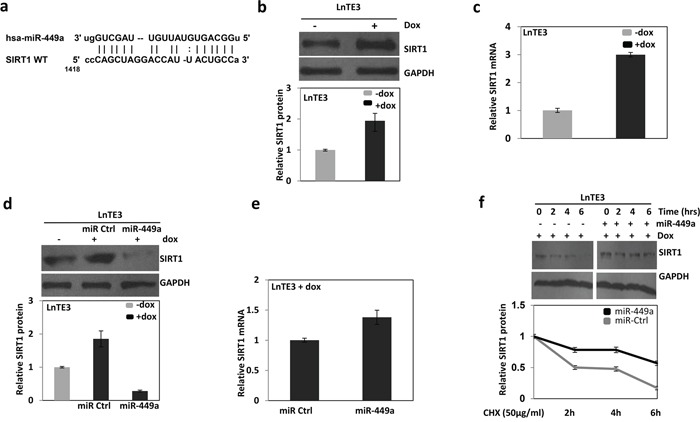
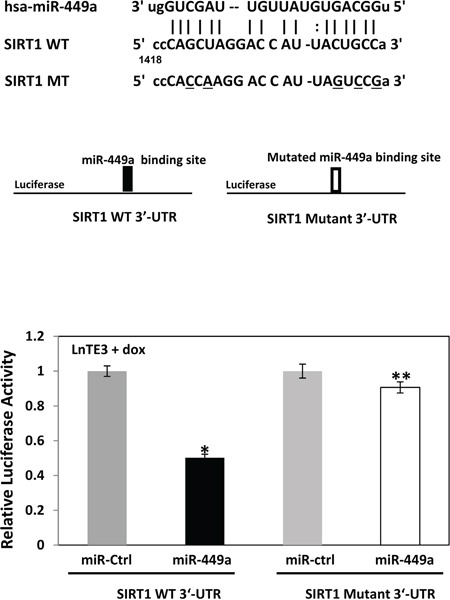
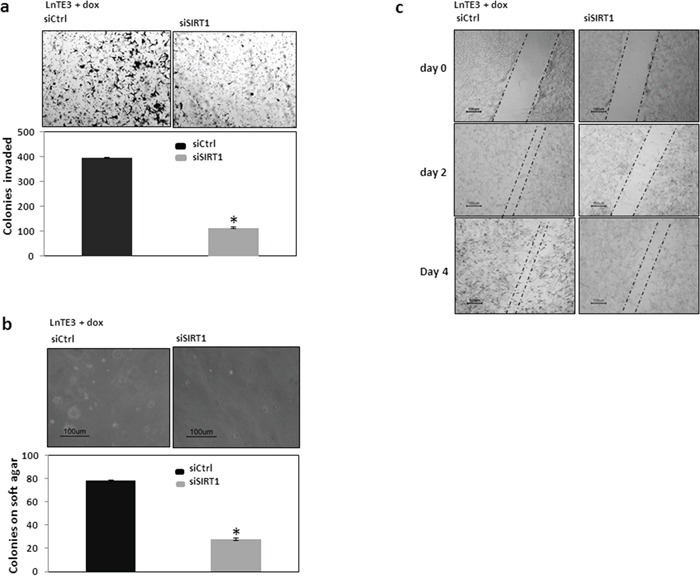
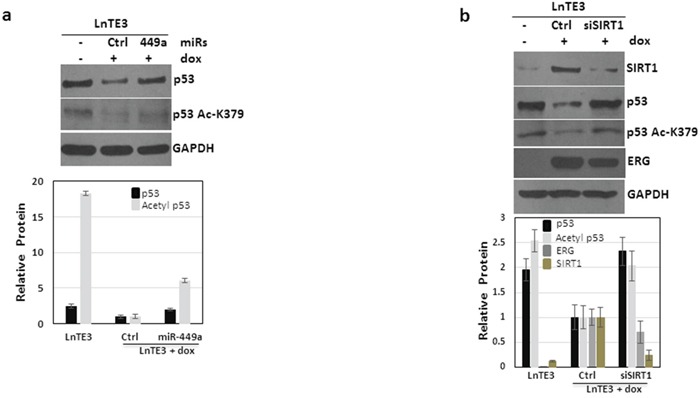
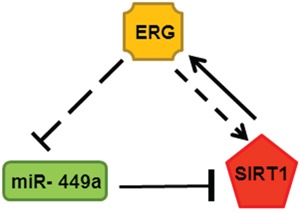
Epigenetic regulation by SIRT1, a multifaceted NAD+-dependent protein deacetylase, is one of the most common factors modulating cellular processes in a broad range of diseases, including prostate cancer (CaP). SIRT1 is over-expressed in CaP cells, however the associated mechanism is not well understood. To identify whether specific microRNAs might mediate this linkage, we have screened a miRNA library for differential expression in ERG-associated CaP tissues. Of 20 differentially and significantly expressed miRNAs that distinguish ERG-positive tumors from ERG-negative tumors, we find miR-449a is highly suppressed in ERG-positive tumors. We establish that SIRT1 is a direct target of miR-449a and is also induced by ERG in ERG-associated CaP. Our data suggest that attenuation of miR-449a promotes the invasive phenotype of the ERG-positive CaP in part by inducing the expression of SIRT1 in prostate cancer cells. Furthermore, we also find that suppression of SIRT1 results in a significant reduction in ERG expression in ERG-positive CaP cells, indicating a feed-back regulatory loop associated with ERG, miR-449a and SIRT1. We also report that ERG suppresses p53 acetylation perhaps through miR-449a-SIRT1 axis in CaP cells. Our findings provide new insight into the function of miRNAs in regulating ERG-associated CaP. Thus, miR-449a activation or SIRT1 suppression may represent new therapeutic opportunity for ERG-associated CaP.

Keywords: ERG; SIRT1; miR-449a; microRNA; prostate cancer.


Conflict of interest statement

All authors have no conflicts of interest in this study.

Figures

Figure 1
Figure 1. miRNA expression in ERG-associated CaP tissues
Epithelial cells were isolated from human CaP tissues by Laser Capture Micro-dissection. The miRNA expression profile in ERG-positive CaP cells compared to that in ERG-negative CaP cells shows significant differences (p value ≤ 0.05, n = 6) in the expression of 20 miRNAs (Red: high-expression, Green: low-expression).
Figure 2
Figure 2. Validation of ERG-associated miRNAs in CaP cells
The expression of a selected set of miRNAs, which exhibited altered expression in ERG-positive CaP tumor tissues compared to ERG-negative CaP tumors is further validated in two different CaP cell lines, LnTE3 and VCaP cells. LnTE3 cells (LNCaP-lentivirus TMPRESS2:ERG3, inducible) were treated with doxycycline (1μg/ml) for 72 hrs to induce ERG expression: a. protein analyzed by immunoblot and b. TMPRESS2-ERG mRNA analyzed by qPCR. c. The expression of miR-125-5p, miR-520g, miR-874, miR-449a and miR-660 was analyzed by Taqman miR-specific assays in LnTE3 cells. VCaP cells were treated with siERG or control siRNA, both d. ERG protein and e. mRNA were analyzed by immunoblot and qPCR, respectively. f. The expression of miR-125-5p, miR-520g, miR-874, miR-449a and miR-660 was similarly analyzed by miR-specific Taqman assays in VCaP cells. For all miR-specific assays RNU48 was used as an endogenous control. The data reflect averages of at least three independent experiments (* indicates p<0.05).
Figure 3
Figure 3. Analyses of ERG-associated genes in LnTE3
a. The expression of ERG-associated genes including AR, PSA/KLK3 and PMEPA1 were analyzed by qPCR using TaqMan gene expression assays in LnTE3 cells (2.5 × 10⁵) induced with doxycycline (dox, 1μg/ml). b. AR, PSA and PMEPA1 protein expression was analyzed by immunoblot in LnTE3 cells: Lane 1 (control) without dox, Lane 2 with dox, Lane 3 with dox and anti-miR-874 (20 nM) and Lane 4 with dox and pre-miR-449a (20nM). The relative quantification is indicated below. c. Corresponding mRNA expression was analyzed by qPCR. The modulation of miR-449a and miR-874 in LnTE3 cells was also separately verified as described. d. miR-449a expression was assayed in dox-treated LnTE3 cells incubated with pre-miR-449a (miR-449a, 20nM) and its negative control (miR-ctrl, 20nM) for 48 hr miR-specific TaqMan assay. e. Similarly, miR-874 expression was analyzed by TaqMan assays in dox-treated LnTE3 cells incubated with anti-miR-874 (20 nM) or respective negative control (anti-miR ctrl, 20nM) for 48hr.
Figure 4
Figure 4. Functional effect of restoring miR-449a and miR-874 in CaP cells
LnTE3 cells (2.5 × 10⁵) were seeded in 6-well plates and were either untreated, or treated with doxycycline (1μg/ml) and transfected with pre-miR-449a or anti-miR-874 and respective controls the following day. a. For analyses of cell invasion, an aliquot of transfected cells (1 × 10⁵) were suspended in serum-free medium and incubated in transwell Matrigel invasion chambers for 48 h. The invaded cells were then stained with crystal violet and photographed. ERG over expression in LnTE3 cells enhance cell invasion as shown (top panel). Cell invasion in ERG-induced LnTE3 cells exhibiting increased miR-449a expression (middle panel) or those in which miR-874 was suppressed (bottom panel) are indicated. Experiments were repeated at least 3 times and one representative result is shown. Quantitative graphical presentation of representative results of cell invasion assays is shown for each category on the right side. Values shown are the average of at least three independent experiments (means ± SD). *p<0.05 b. Anchorage-independent growth was determined by the Colony formation assay in soft agar. LnTE3 cells were transfected as mentioned above and 24 hr post transfection, 1 × 10⁵ cells were mixed with 2 ml of culture media containing 0.3% Difco agar Noble and then overlaid on 1 ml of 0.5% agar in 6 well plate culture dishes. After 3-4 weeks, colonies were visualized under microscope at a magnification of 10X and counted. Representative cell colonies in soft agar are shown. Induction of ERG enhanced formation of soft agar colonies by number and size as apparent after 21 days (top panel). Overexpression of miR-449a or suppression of miR-874 reverts the effects as depicted (middle and bottom panel, respectively). Quantitative analysis of colony numbers is shown in the graphical representation for each comparison. Values shown are the average of at least three independent experiments (means ± SD). *p<0.05. c. For wound scratch assay, LnTE3 cells were seeded in 6 wells plate with or without doxycycline and grown up to 90% confluence. A single wound was made in center of cell monolayer. Cells were washed 2 times with PBS and transfected with respective microRNAs or controls. The wound closure areas were visualized under an inverted microscope as shown. The ERG overexpression increased cell migration (left panel), which was inverted by overexpression of miR-449a (middle panel) or suppression of miR-874 (right panel). Scratch assays were performed at least three times and representative results are shown.
Figure 5
Figure 5. ERG and miR-449a reciprocally regulate the expression of SIRT1 in ERG-associated LnTE3 cells
a. The SIRT1 3′UTR miR-449a putative target site. SIRT1 expression in LnTE3, either untreated or treated with doxycycline (1μg/ml) was analyzed by b. immunoblot and c. qPCR. Similarly, SIRT1 d. protein and e. corresponding mRNA was also analyzed in LnTE3 cells treated with doxycycline and transfected with pre miR-449a as well as respective controls. The graph below the immunoblot represents relative protein quantification. f. Dox-treated LnTE3 cells transfected with pre miR-449a or respective control (20nM each) for 48 hr. Subsequently, the cells were incubated with cycloheximide (CHX, 50μg/ml) for the indicated time intervals (0, 2, 4 and 6 hours) and SIRT1 expression was analyzed by immunoblot. The relative amount of SIRT1 protein was quantified (Bottom panel). Error bars represent data from three independent experiments (mean ± SD).
Figure 6
Figure 6. SIRT1 is a direct target of miR-449a in ERG-associated LnTE3 cells
The miR-449a target 3′-UTR SIRT1 sequences as well as that of the mutated-derivative are indicated. Luciferase reporter assays were performed in ERG-inducible LnTE3 cells transfected with pMIR-Report vectors, either controls or those containing SIRT1 3′-UTR target sequences of miR-449a (both wildtype [WT] and mutant [mt]), in the presence or absence of pre-miR-449a. The data reflect averages of at least three independent experiments (* indicates p<0.05, ** indicates p>0.05).
Figure 7
Figure 7. Functional analyses of SIRT1 in ERG-inducible LnTE3 cells
LnTE3 cells were treated with doxycycline (1μg/ml) and transfected with siSIRT1 and its controls (20nM each) using siPORT transfection reagent the following day. a. Cell invasion b. Colony formation and c. Cell migration at different time intervals were analyzed as described earlier. The data is representative of three independent experiments (mean ± SD).
Figure 8
Figure 8. ERG regulates p53 signaling
LnTE3 cells (2.5 × 10⁵) were either untreated or treated with doxycycline (1μg/ml) and transfected with pre miR-449a or siSIRT1 RNA and respective controls (20nM each) using siPORT transfection reagent on the following day. a. Total and acetylated p53 proteins levels were analyzed by immunoblot in dox-treated LnTE3 cells incubated with pre miR-449a (48 h). b. SIRT1, ERG, p53 (total and acetylated) protein expression was analyzed by immunoblot in dox-treated LnTE3 cells incubated with siSIRT (48 h). The relative quantification are indicated below the corresponding immunoblot. The data is representative of three independent experiments (mean ± SD).
Figure 9
Figure 9. Feed-back regulatory loop associated with ERG, miR-449a (green: down-regulated) and SIRT1 (red: up-regulated) in depicted in the schematic

Similar articles

Cited by

References

    1. Rosen P, Sesterhenn IA, Brassell SA, McLeod DG, Srivastava S, Dobi A. Clinical potential of the ERG oncoprotein in prostate cancer. Nature reviews Urology. 2012;9:131–137. - PubMed
    1. Petrovics G, Liu A, Shaheduzzaman S, Furusato B, Sun C, Chen Y, Nau M, Ravindranath L, Dobi A, Srikantan V, Sesterhenn IA, McLeod DG, Vahey M, Moul JW, Srivastava S. Frequent overexpression of ETS-related gene-1 (ERG1) in prostate cancer transcriptome. Oncogene. 2005;24:3847–3852. - PubMed
    1. Tomlins SA, Laxman B, Varambally S, Cao X, Yu J, Helgeson BE, Cao Q, Prensner JR, Rubin MA, Shah RB, Mehra R, Chinnaiyan AM. Role of the TMPRSS2-ERG gene fusion in prostate cancer. Neoplasia. 2008;10:177–188. - PMC - PubMed
    1. Boysen G, Barbieri CE, Prandi D, Blattner M, Chae SS, Dahija A, Nataraj S, Huang D, Marotz C, Xu L, Huang J, Lecca P, Chhangawala S, Liu D, Zhou P, Sboner A, et al. SPOP mutation leads to genomic instability in prostate cancer. eLife. 2015:4. - PMC - PubMed
    1. Kumar-Sinha C, Kalyana-Sundaram S, Chinnaiyan AM. Landscape of gene fusions in epithelial cancers: seq and ye shall find. Genome medicine. 2015;7:129. - PMC - PubMed