. 2016 May 1;143(9):1452-63.
doi: 10.1242/dev.131490. Epub 2016 Mar 17.

Trop2 marks transient gastric fetal epithelium and adult regenerating cells after epithelial damage

Affiliations

Trop2 marks transient gastric fetal epithelium and adult regenerating cells after epithelial damage

Valeria Fernandez Vallone et al. Development. .

Abstract

Mouse fetal intestinal progenitors lining the epithelium prior to villogenesis grow as spheroids when cultured ex vivo and express the transmembrane glycoprotein Trop2 as a marker. Here, we report the characterization of Trop2-expressing cells from fetal pre-glandular stomach, growing as immortal undifferentiated spheroids, and their relationship with gastric development and regeneration. Trop2(+) cells generating gastric spheroids differed from adult glandular Lgr5(+) stem cells, but appeared highly related to fetal intestinal spheroids. Although they shared a common spheroid signature, intestinal and gastric fetal spheroid-generating cells expressed organ-specific transcription factors and were committed to intestinal and glandular gastric differentiation, respectively. Trop2 expression was transient during glandular stomach development, being lost at the onset of gland formation, whereas it persisted in the squamous forestomach. Undetectable under homeostasis, Trop2 was strongly re-expressed in glands after acute Lgr5(+) stem cell ablation or following indomethacin-induced injury. These highly proliferative reactive adult Trop2(+) cells exhibited a transcriptome displaying similarity with that of gastric embryonic Trop2(+) cells, suggesting that epithelium regeneration in adult stomach glands involves the partial re-expression of a fetal genetic program.

Keywords: Embryonic; Indomethacin; Lgr5; Spheroids; Stomach; Tacstd2.


Conflict of interest statement

Competing interests

The authors declare no competing or financial interests.

Figures
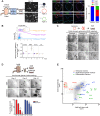
Fig. 1.
Fig. 1.
Gastric Trop2-expressing fetal cells grow as immortal spheroids ex vivo. (A) Spheroid-generating cells originate from pre-glandular stomach. (Left) Sorted Trop2+ cells from E14.5 proximal and distal stomach regions were cultured in ENR (EGF, noggin, R-spondin 1) conditions for 10 days. (Right) Immunofluorescence for type 1, 2 and 3 elements showing keratin 14 (Krt14), Muc5ac (HGM antibody) and Trop2 expression. Arrows indicate stratified cells. The proportion of the three types grown from each source is shown far right; mean±s.e.m. (n=2 independent sorting experiments). (B) Spheroid formation efficiency among Epcam+ cells isolated from distal stomach depends on embryonic stage and Trop2 expression (n=2 independent sorting experiments). None of the Epcam cells generated spheroids. (C) Representative images of fetal stomach spheroids from three different pools during passages. (D) Representative images from initial seeding of adult antral glands under ENR and ENRFGW (ENR plus Fgf10, gastrin, Wnt3a) conditions. The same field was followed over time; arrow shows a differentiating organoid element. Beneath is shown the percentage of surviving elements over time (n=4 mice). Two-way ANOVA, ****P<0.0001 for medium/time effect; Bonferroni, a,b P<0.0001. (E) Transcriptome analysis of gastric fetal spheroids (three independent pools) and sorted adult Lgr5+ stem cells (four mice pooled) presented as a scatter plot of the log2 mean. Rpm, reads per million. Genes representing embryonic, adult stem/progenitor or glandular differentiation markers are highlighted. Scale bars: 1 mm in A left; 20 µm in A right; 200 µm in C,D.
Fig. 2.
Fig. 2.
Spheroid-generating cells are committed to a gastric glandular fate. (A) PCA plot of transcriptome (19,468 genes) from cultured stomach (Sto-Sph) and intestinal (SI-Sph) spheroids, intestinal organoids (SI-Org) and sorted stomach and intestinal Trop2+ cells (Sto-Trop2+ and SI-Trop+). (B) The Venn diagram shows the overlap between ≥4-fold upregulated genes (number of genes in parentheses) in stomach and intestinal spheroids (both versus intestinal organoids). Chi-square with Yates’ correction. GO term analysis is shown for the common ‘fetal spheroid signature’. (C) (Left) Scatter plot of gastric and intestinal fetal spheroid transcriptomes (three independent pools) presented as the log2 mean. Rpm, reads per million. Genes representing gastric and intestinal commitment are highlighted. (Right) Sox2 and Cdx2 mRNA expression levels measured by qRT-PCR in stomach spheroids (Sto Sph; n=6), stomach organoids (Sto Org; n=5), small intestine spheroids (SI Sph; n=4) and small intestine organoids (SI Org; n=4). Asterisks indicate values below the mean value of 0.05. (D) Stomach spheroid cells can differentiate in ENRFGW medium. qRT-PCR of selected gastric differentiation genes in Sto Sph at day 6 and day 12 (n=4), using Sto Org (n=3) obtained at day 12 as a positive differentiation control. Mucin 6 (Muc6), pepsinogen C (Pgc; also known as progastricsin), chromogranin A (Chga) and proton pump (Atp4a) are markers of mucus neck, chief, endocrine and parietal cells, respectively. Two-way ANOVA, P=0.0018 for media effect on Sto Sph. (E) Immunofluorescence showing low and high magnification for Trop2 staining, or cell differentiation markers (HGM, GS-II and ChgA), of spheroids cultured under ENR or ENRFGW conditions, with stomach organoids as positive controls. Membrane Epcam and E-cadherin (Ecadh) stainings help to define epithelial cell limits. Arrows indicate differentiated cells. Scale bars: 20 µm.
Fig. 3.
Fig. 3.
Transient expression of Trop2 and Cnx43 markers in pre-glandular epithelial cells. (A) (Left) Immunofluorescence showing expression of Trop2 and Cnx43 during development. Arrows point to absence of Trop2 expression at the bottom of the glands, where positive punctate staining of Cnx43 is still present. (Right) The proportion of apical and basal cells expressing Trop2 (top) and the proportion of cells expressing embryonic markers in the most basal cells (bottom). n=3 embryos per time point. Two-way ANOVA, *P<0.05, **P<0.01, ***P<0.001, ****P<0.0001. (B) Representative images for lineage-tracing experiments in Cnx43-CreER/Rosa26R-YFP mice. Low and high magnification of squamous (Sq) and glandular (Gl) stomach; tamoxifen was administrated at E14.5 and analyzed 1, 3 and 28 days post pulse (dpp). duo, duodenum. Dotted lines delineate epithelial/mesenchymal boundaries. (C) Relative proportion of Cnx43-traced clone area per total Gl or Sq epithelial area. Each dot corresponds to a single embryo/mouse. Non-parametric one-way ANOVA, *P<0.05. Scale bars: 20 µm in A; 500 µm (low magnification) and 20 µm (high magnification) in B.
Fig. 4.
Fig. 4.
Re-expression of the Trop2 marker in damaged adult stomach. (A) Design of the experiment for Lgr5+ cell ablation in Lgr5-DTR mice with diphtheria toxin (DT). EP, endpoint. (B) Immunohistochemistry of antral gland sections showing Trop2 expression after DT treatment of wild-type (WT-T) or heterozygous Lgr5-DTR (HE-T) mice. (C) Quantification of Trop2+ clusters per field in HE-T and control (label C; non-treated heterozygous Lgr5-DTR HE-NT and WT-T) animals. Individual mice are represented by the green circles and red squares. Unpaired t-test with Welch's correction; antrum, *P=0.023, **P=0.002; corpus, *P=0.017, **P=0.007. (D) Quantification of the number of Trop2+ cells/cluster over time. Mice: n=3 at day 2; n=4 at day 3 and day 5. Two-way ANOVA, ****P=0.0008. (E) (Left) Quantification of total number of Ki67+ cells per antral gland. Mice: n=3 at all time points for control; n=3, 4 and 7 for HE-T at day 2, day 3 and day 5, respectively. Two-way ANOVA, P<0.0001 for treatment effect; Bonferroni, *P=0.03, **P=0.004. (Right) Immunofluorescence showing co-expression of Ki67 in Trop2+ cells in HE-T glands. The percentage of Trop2+ proliferating cells is indicated (n=3 and 4 at day 2 and day 5, respectively). (F) (Left) Experimental scheme for in vivo treatment with indomethacin (Ind). (Right) Representative immunohistochemistry showing Trop2 expression in the vicinity of Ind-induced lesions. (G) Quantification of Trop2+ clusters/10 fields in Ind-treated and vehicle-treated control animals. Non-parametric Mann–Whitney; antrum and corpus, *P=0.0159. (H) Representative immunofluorescence showing co-expression of Ki67 and Trop2 in glands of Ind-treated mice. The percentage of Trop2+ proliferating cells is indicated (n=2). Scale bars: 50 µm in B; 20 µm in B insets, E,H; 200 µm (low magnification) and 100 µm (high magnification) in F.
Fig. 5.
Fig. 5.
Cells at the origin of reactive adult Trop2+ cells. The two experimental models of injury are illustrated at the very top: the Lgr5-DTR model of localized specific ablation of the stem cell population (A) and the indomethacin-induced injury model that leads to extended damage throughout the epithelium (B). (A) (Top) Spatial distribution of Trop2+ cells after Lgr5+ cell ablation along antral glands (subdivided into top, middle and bottom zones, as depicted). Mice: n=3 at day 2 and 3, n=4 at day 5. (Bottom) Immunofluorescence showing co-expression of differentiation markers in Trop2+ cells of HE-T glands at day 2. Arrows indicate double-positive cells. Dotted lines outline gland limits and double-positive cells. (B) Immunofluorescence showing co-expression of differentiation markers in Trop2+ cells from indomethacin-treated mice. Arrows indicate double-positive cells. Scale bars: 20 µm.
Fig. 6.
Fig. 6.
Characterization of reactive adult Trop2+ cells following Lgr5+ stem cell ablation. (A) Trop2+ cell isolation by FACS after DT treatment of Lgr5-DTR mice. (Left) Experimental scheme. (Right) Representative FACS plots. Percentages of Lgr5+ (green oval) or Trop2+ (red circle) cells per gate are shown as mean±s.e.m. for treated wild-type (WT-T; n=1), non-treated heterozygous (HE-NT; n=4) and treated heterozygous (HE-T; n=4) mice. (B) PCA plot of the whole transcriptome (19,468 genes) from sorted adult and fetal cells and fetal-derived spheroids. See legend to Fig. 2A. (C) Venn diagram showing overlap between ≥4-fold upregulated genes (number of genes in parentheses) in reactive adult and fetal Trop2+ cells versus Lgr5+ cells, with the fetal spheroid signature as defined in Fig. 2B. GO term analysis is shown for the genes common to the three lists. (D) Ex vivo culture of Lgr5-DTR antral glands after in vivo DT treatment. Control (C) mice are WT-T and HE-NT. Individual C and HE-T mice are represented by green circles and red squares, respectively. (Top) Experimental design. (Left) Representative images of immunofluorescence showing Trop2 expression at day 6 and quantification as a percentage of growing elements. Unpaired t-test, ****P=0.0001. (Center) Representative images of growing elements at day 12 after initial seeding of antral glands. Arrows point to surviving elements. Quantification of the mean diameter of elements/animal is shown. Unpaired t-test, **P=0.0017. (Right) Survival of replated elements at passage 1, day 9. Representative images are shown of elements grown from HE-T glands. Each square corresponds to an individual mouse; empty and filled squares represent no growth and growth, respectively. Fisher's exact test. Scale bars: 20 µm, left; 1 mm, center; 100 µm, right.

Similar articles

Cited by

References

    1. Anthony A., Pounder R. E., Dhillon A. P. and Wakefield A. J. (2000). Similarities between ileal Crohn's disease and indomethacin experimental jejunal ulcers in the rat. Aliment. Pharmacol. Ther. 14, 241-245. 10.1046/j.1365-2036.2000.00694.x - DOI - PubMed
    1. Arnold K., Sarkar A., Yram M. A., Polo J. M., Bronson R., Sengupta S., Seandel M., Geijsen N. and Hochedlinger K. (2011). Sox2(+) adult stem and progenitor cells are important for tissue regeneration and survival of mice. Cell Stem Cell 9, 317-329. 10.1016/j.stem.2011.09.001 - DOI - PMC - PubMed
    1. Barbera M., di Pietro M., Walker E., Brierley C., MacRae S., Simons B. D., Jones P. H., Stingl J. and Fitzgerald R. C. (2015). The human squamous oesophagus has widespread capacity for clonal expansion from cells at diverse stages of differentiation. Gut 64, 11-19. 10.1136/gutjnl-2013-306171 - DOI - PMC - PubMed
    1. Barker N., van Es J. H., Kuipers J., Kujala P., van den Born M., Cozijnsen M., Haegebarth A., Korving J., Begthel H., Peters P. J. et al. (2007). Identification of stem cells in small intestine and colon by marker gene Lgr5. Nature 449, 1003-1007. 10.1038/nature06196 - DOI - PubMed
    1. Barker N., Huch M., Kujala P., van de Wetering M., Snippert H. J., van Es J. H., Sato T., Stange D. E., Begthel H., van den Born M. et al. (2010). Lgr5(+ve) stem cells drive self-renewal in the stomach and build long-lived gastric units in vitro. Cell Stem Cell 6, 25-36. 10.1016/j.stem.2009.11.013 - DOI - PubMed

Publication types