. 2016 Jun;11(6):1002-16.
doi: 10.1093/scan/nsw027. Epub 2016 Mar 17.

Sex differences in autism: a resting-state fMRI investigation of functional brain connectivity in males and females

Affiliations

Sex differences in autism: a resting-state fMRI investigation of functional brain connectivity in males and females

Kaat Alaerts et al. Soc Cogn Affect Neurosci. 2016 Jun.

Abstract

Autism spectrum disorders (ASD) are far more prevalent in males than in females. Little is known however about the differential neural expression of ASD in males and females. We used a resting-state fMRI-dataset comprising 42 males/42 females with ASD and 75 male/75 female typical-controls to examine whether autism-related alterations in intrinsic functional connectivity are similar or different in males and females, and particularly whether alterations reflect 'neural masculinization', as predicted by the Extreme Male Brain theory. Males and females showed a differential neural expression of ASD, characterized by highly consistent patterns of hypo-connectivity in males with ASD (compared to typical males), and hyper-connectivity in females with ASD (compared to typical females). Interestingly, patterns of hyper-connectivity in females with ASD reflected a shift towards the (high) connectivity levels seen in typical males (neural masculinization), whereas patterns of hypo-connectivity observed in males with ASD reflected a shift towards the (low) typical feminine connectivity patterns (neural feminization). Our data support the notion that ASD is a disorder of sexual differentiation rather than a disorder characterized by masculinization in both genders. Future work is needed to identify underlying factors such as sex hormonal alterations that drive these sex-specific neural expressions of ASD.

Keywords: autism spectrum disorders; functional connectivity; resting-state fMRI; sex differences.


Figures

Fig. 1.
Fig. 1.
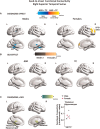
Seed-to-voxel connectivity of the right superior temporal sulcus (STS). (A) Clusters for which a main effect of diagnosis was revealed, separately for males (left) and females (right). Clusters showing hypo-connectivity (ASD<TC) are shown in blue; clusters showing hyper-connectivity (ASD>TC) are shown in red-yellow. As shown in (B), no significant main effect of sex was revealed for the right STS seed. (C) Clusters for which a diagnosis-by-sex interaction effect was revealed (left). The line plots (right) show functional connectivity scores as a function of diagnostic group (filled circles, ASD; open circles, TC), separately for males (grey lines) and females (pink lines). The thalamus cluster exhibited a diagnosis-by-sex interaction but also a diagnosis main effect in males (panel A, left). L, left hemisphere; R, right hemisphere; FG, fusiform gyrus; IFG, inferior frontal gyrus; SFG, superior frontal gyrus; SMG, superior medial gyrus. Vertical lines in the line plots denote SEM. Clusters are reported at a P < 0.05, FDR-corrected cluster-wise threshold. Significant clusters are overlaid on inflated surface maps generated using BrainNet Viewer (http://www.nitrc.org/projects/bnv/). Clusters are also listed in Supplementary Table 1.
Fig. 2.
Fig. 2.
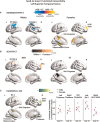
Seed-to-voxel connectivity of the left superior temporal sulcus (STS). (A) Clusters for which a main effect of diagnosis was revealed, separately for males (left) and females (right). Clusters showing hypo-connectivity (ASD<TC) are shown in blue; clusters showing hyper-connectivity (ASD>TC) are shown in red-yellow. (B) Clusters for which a main effect of sex was revealed, separately for ASD (left) and TC groups (right). Clusters showing higher connectivity in males are shown in brown; clusters showing higher connectivity in females are shown in pink-orange. (C) Clusters for which a diagnosis-by-sex interaction effect was revealed (left). The line plots (right) show functional connectivity scores as a function of diagnostic group (filled circles, ASD; open circles, TC), separately for males (grey lines) and females (pink lines). The left BA 6 cluster exhibits a diagnosis-by-sex interaction but also a diagnosis effect in males (panel A, left) and a sex main effect in the ASD (panel B, left). Clusters showing a diagnosis-by-sex interaction in the parahippocampal gyrus/thalamus, mid cingulum and right SFG/SMG overlapped with clusters identified to show a diagnosis effect in females (panel A, right) and sex effects either in the ASD group (panel B, left, for the right SFG/SMG cluster) or in the TC group (panel B, right, for mid cingulum cluster). L, left hemisphere; R, right hemisphere; BA, Brodmann area; IPC, inferior parietal cortex; SFG, superior frontal gyrus; SMG, superior medial gyrus. Vertical lines in the line plots denote SEM. Clusters are reported at a p < 0.05, FDR-corrected cluster-wise threshold. Significant clusters are overlaid on inflated surface maps generated using BrainNet Viewer (http://www.nitrc.org/projects/bnv/). Clusters are also listed in Supplementary Table S2.
Fig. 3.
Fig. 3.
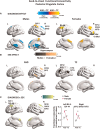
Seed-to-voxel connectivity of the posterior cingulate cortex (PCC). (A) Clusters for which a main effect of diagnosis was revealed, separately for males (left) and females (right). Clusters showing hypo-connectivity (ASD<TC) are shown in blue; clusters showing hyper-connectivity (ASD>TC) are shown in red-yellow. (B) Clusters for which a main effect of sex was revealed, separately for ASD (left) and TC groups (right). Clusters showing higher connectivity in males are shown in brown; clusters showing higher connectivity in females are shown in pink-orange. (C) Clusters for which a diagnosis-by-sex interaction effect was revealed (left). The line plots (right) show functional connectivity scores as a function of diagnostic group (filled circles, ASD; open circles, TC), separately for males (grey lines) and females (pink lines). The right SFG/SMG/MFG and left BA 6/BA 44 clusters showing a diagnosis-by-sex interaction overlap with clusters identified to show a diagnosis effect in females (panel A, right) and a sex effect in the ASD group (panel B, left). L, left hemisphere; R, right hemisphere; BA, Brodmann area;; MTG, middle temporal gyrus; SFG, superior frontal gyrus; SMG, superior medial gyrus; MFG, middle frontal gyrus; IFG, inferior frontal gyrus; STG, superior temporal gyrus. Vertical lines in the line plots denote SEM. Clusters are reported at a p < 0.05, FDR-corrected cluster-wise threshold. Significant clusters are overlaid on inflated surface maps generated using BrainNet Viewer (http://www.nitrc.org/projects/bnv/). Clusters are also listed in Supplementary Table S3.
Fig. 4.
Fig. 4.
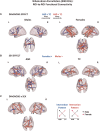
Region-to-region functional connectivity within a whole-brain parcellation comprising of 200 regions of interest (ROIs). (A) Connections for which a main effect of diagnosis was revealed, separately for males (left) and females (right). Connections showing hypo-connectivity (ASD<TC) are shown in blue; connections showing hyper-connectivity (ASD>TC) are shown in red. (B) Connections for which a main effect of sex was revealed, separately for ASD (left) and TC groups (right). Connections showing higher connectivity in females are shown in blue; clusters showing higher connectivity in males are shown in red. (C) Connections for which a diagnosis-by-sex interaction effect was revealed (left). The line plots (right) show the identified interaction patterns as a function of diagnostic group (filled circles, ASD; open circles, TC), and sex (grey lines, males; pink lines, females). For completeness, ROI-to-ROI connections are reported at an uncorrected p < 0.001 threshold. L, left hemisphere; R, right hemisphere. Connections shown in panel A and B are listed in Supplementary Table S4. Connections shown in panel C are listed in Table 2.

References

    1. Alaerts K., Woolley D.G., Steyaert J., Di M.A., Swinnen S.P., Wenderoth N. (2014). Underconnectivity of the superior temporal sulcus predicts emotion recognition deficits in autism. Social Cognitive and Affective Neuroscience, 9, 1589–600. - PMC - PubMed
    1. Alaerts K., Nayar K., Kelly C., Raithel J., Milham M.P., Martino D. A. (2015). Age-related changes in intrinsic function of the superior temporal sulcus in autism spectrum disorders. Social Cognitive and Affective Neuroscience 10, 1413–23. - PMC - PubMed
    1. Allen E.A., Erhardt E.B., Damaraju E., et al. (2011). A baseline for the multivariate comparison of resting-state networks. Frontiers in Systems Neuroscience, 5, 2.. - PMC - PubMed
    1. Assaf M., Jagannathan K., Calhoun V.D., et al. (2010). Abnormal functional connectivity of default mode sub-networks in autism spectrum disorder patients. Neuroimage, 53, 247–56. - PMC - PubMed
    1. Auyeung B., Baron-Cohen S., Ashwin E., Knickmeyer R., Taylor K., Hackett G. (2009). Fetal testosterone and autistic traits. The British Journal of Psychiatry, 100, 1–22. - PubMed

Publication types