. 2016 Jun 2;127(22):2723-31.
doi: 10.1182/blood-2015-07-659938. Epub 2016 Mar 17.

GNA13 loss in germinal center B cells leads to impaired apoptosis and promotes lymphoma in vivo

Affiliations

GNA13 loss in germinal center B cells leads to impaired apoptosis and promotes lymphoma in vivo

Jane A Healy et al. Blood. .

Abstract

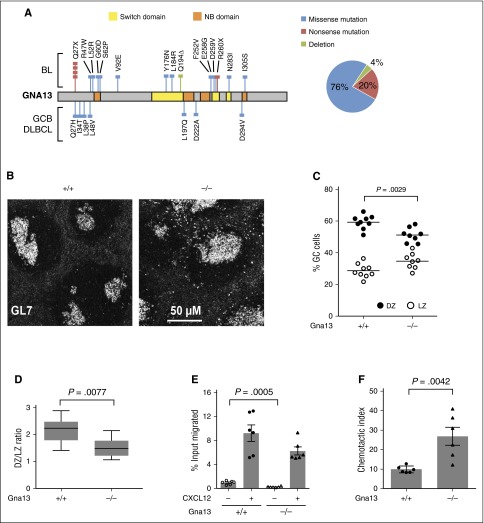
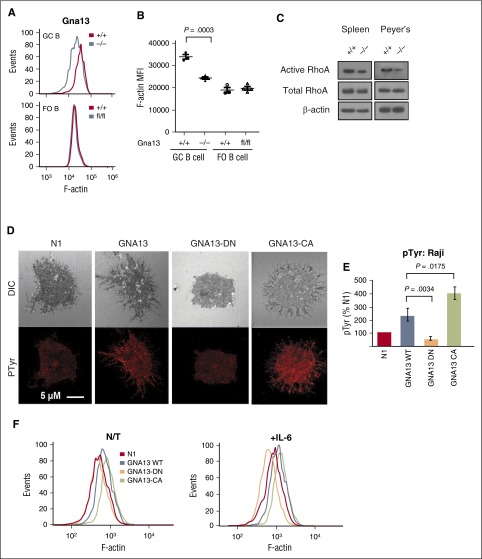
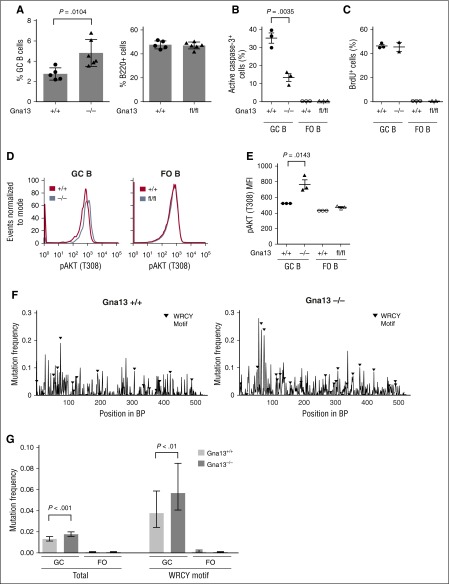
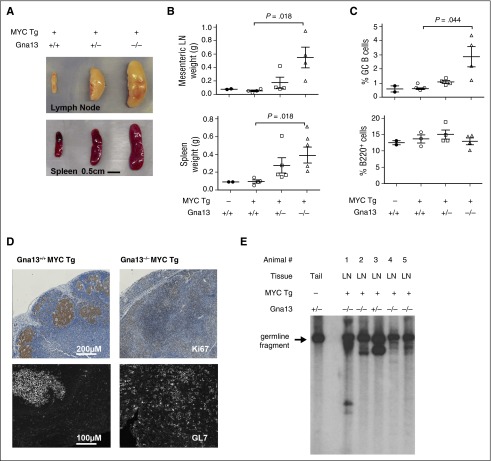
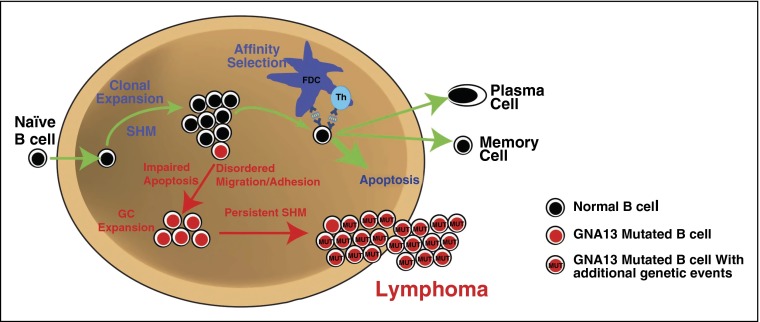
GNA13 is the most frequently mutated gene in germinal center (GC)-derived B-cell lymphomas, including nearly a quarter of Burkitt lymphoma and GC-derived diffuse large B-cell lymphoma. These mutations occur in a pattern consistent with loss of function. We have modeled the GNA13-deficient state exclusively in GC B cells by crossing the Gna13 conditional knockout mouse strain with the GC-specific AID-Cre transgenic strain. AID-Cre(+) GNA13-deficient mice demonstrate disordered GC architecture and dark zone/light zone distribution in vivo, and demonstrate altered migration behavior, decreased levels of filamentous actin, and attenuated RhoA activity in vitro. We also found that GNA13-deficient mice have increased numbers of GC B cells that display impaired caspase-mediated cell death and increased frequency of somatic hypermutation in the immunoglobulin VH locus. Lastly, GNA13 deficiency, combined with conditional MYC transgene expression in mouse GC B cells, promotes lymphomagenesis. Thus, GNA13 loss is associated with GC B-cell persistence, in which impaired apoptosis and ongoing somatic hypermutation may lead to an increased risk of lymphoma development.


Figures

Figure 1
Figure 1
GNA13 loss results in abnormal GC architecture and altered chemokine-directed migration. (A) GNA13 mutations identified by exome sequencing in GC B-cell subtype (GCB) DLBCL and Burkitt lymphoma (BL) are depicted along the length of the gene, shown in gray. Colored lines indicate the type of mutation (blue corresponding to missense, red for nonsense, and green for deletion) and the colored boxes represent important functional domains. The switch domain, shown in yellow, is important for initiating conformational changes in GNA13 that affect its guanosine triphosphate binding affinity. The nucleotide binding (NB) domain, shown in orange, forms the guanosine triphosphate binding site. The pie chart (right) shows the percentage of GNA13 mutations that are missense, nonsense, or deletion. (B) Immunofluorescent staining of GC B cells (GL7+, white) in sections of spleen from 3-month-old AID-Cre+ Gna13 cohort mice. Images are representative of 3 animals per genotype. (C) Dot plot showing the percentage of CXCR4+CD83 GC cells (DZ) compared with CXCR4CD83+ (LZ) cells in GC B cells from Peyer patches of AID-Cre+ Gna13 mice. Dots represent individual animals, with DZ cells indicated in black and LZ cells indicated in white. (D) Box and whisker plot of the average DZ:LZ ratio across genotypes. Data are the summation of 3 experiments. (E) Transwell migration of splenic GC cells isolated from 2-month-old AID-Cre+ Gna13 mice with and without CXCL12 stimulation. (F) Same as panel E, depicted as chemotactic index, the number of cells that migrated over 3 hours toward 100 ng/mL CXCL12 divided by the number of cells that migrated in the absence of chemokine. Data are the representative of 4 experiments.
Figure 2
Figure 2
Effects of Gna13 on cellular adhesion in vivo and in vitro. (A) Representative histogram of F-actin expression in GC B cells (upper) or FO B cells (lower) from AID-Cre+ Gna13 mice. (B) MFI for F-actin expression in AID-Cre+ Gna13 mice as measured by flow cytometric analysis in spleen. Dots represent individual animals. Data are representative of 3 experiments. (C) Western blot showing levels of active (guanosine triphosphate–bound) RhoA, total RhoA, and β-actin in B-cell lysates from spleen (left) and Peyer patches (right) of Mb1-Cre+ Gna13 mice. Data are representative of 3 experiments. (D) Confocal images of Raji cell line stably transfected with lentiviral constructs: vector (N1), wild-type GNA13, dominant-negative (DN) GNA13-DN (G225A), and constitutively active (CA) GNA13-CA (Q226L). Top row: differential interference contrast; bottom row: phosphotyrosine (pTyr) staining in red. Images are representative examples of 3 experiments. Cells were imaged with a Zeiss LSM510 confocal microscope with a 63×/1.4 NA (numerical aperture) oil immersion lens. (E) Representative histogram and quantitation of pTyr expression by immunofluorescence in Raji cells transfected with constructs described in panel D. Values are quantitated as a percentage of N1 control. Results are representative of 3 experiments. (F) Representative histograms of F-actin expression in Raji cell line expressing the constructs described in panel D. Left: nontreated (N/T); right: in the presence of interleukin-6 (IL-6; 20 ng/mL). MFI, mean fluorescence intensity.
Figure 3
Figure 3
Gna13 deletion results in expansion of GC B cells, reduced apoptosis, and increased SHM-related mutational burden. (A) Bar graph comparing the GC populations across genotypes in splenic cells isolated from 2-month-old AID-Cre+ Gna13 mice. GC cells were calculated as a percentage of total B cells (B220+ cells). Data are representative of 3 experiments. Fluorescence-activated cell sorting analysis of active caspase-3 (B) and 5-bromo-2′-deoxyuridine (BrdU) (C) in B cells isolated from spleen of 3-month-old AID-Cre+ Gna13 mice. In each graph, GC cells are depicted on the left, with FO cells on the right as a control. Dots represent individual mice. Data are representative of 3 experiments. (D) Representative histogram of pAKT (T308) expression in GC and FO B cells from spleen of AID-Cre+ Gna13 cohort mice. Wild-type and null GC B cells are depicted by blue and red traces, respectively. (E) MFI for pAKT (T308) expression in AID-Cre+ Gna13 cohort mice as measured by flow cytometry in spleen. Data are representative of 3 experiments. (F-G) SHM analysis of the JH4 intronic region of the VH immunoglobulin locus. Data are depicted as mutational frequency per base across an amplified segment of the JH4 intronic region of GC B cells (F) and quantitated in bar-graph form (G), along with FO controls. WCRY/RGYW hotspot motifs are depicted with black triangles (F) and quantitated separately (G, right). Data reflect an average depth of ∼7500 reads per genotype from GC B cells and from FO B cells isolated from Peyer patches of wild-type or null AID-Cre+ Gna13 animals.
Figure 4
Figure 4
Characterization of B-cell lymphomas arising from AID-Cre+R26StopFLMYC Gna13–deficient mice. (A) Photograph of spleens and mesenteric lymph nodes from representative MYC+ Gna13 genotypes. (B) Comparison of the weights of spleens and mesenteric lymph nodes (LN) from MYC Gna13 wild-type (n = 2) mice and MYC+ Gna13 wild-type (n = 4), heterozygous (n = 5 for spleen, 4 for mesenteric), and null (n = 4) mice. (C) Graph of GC B-cell and total B-cell populations in AID-Cre+ MYC+ Gna13 mice across genotypes. (D) Immunohistochemical staining of proliferation marker Ki67 (top row) or immunofluorescent staining of GC marker GL7 (bottom row) in FFPE sections of mouse lymph node from AID-Cre+ MYC+ Gna13 mice. (E) Tumor clonality as determined by IgH rearrangement patterns. Southern blot analysis was performed using a heavy-chain joining-region probe to detect changes in fragment patterns in EcoRI digested genomic DNA extracted from mouse tissue. The arrow indicates the 6.5-kb germ-line DNA fragment present in wild-type mouse tail DNA, and its presence in all samples reflects the relative contribution of non-B cells to a given sample. Tg, transgenic.
Figure 5
Figure 5
Proposed mechanism whereby GNA13 loss promotes lymphomagenesis within the GC niche. In normal circumstances, GC B cells follow the path depicted with green arrows. Mutations in GNA13 lead to disordered migration and impaired apoptosis. Affected cells likely do not require prosurvival signals from T helper (Th) cells to persist. GC persistence may promote the accumulation of additional mutations through ongoing SHM. Over time, accumulation of driver mutations in persistent GC cells may promote lymphoma. FDC, follicular dendritic cell.

References

    1. Basso K, Dalla-Favera R. Germinal centres and B cell lymphomagenesis. Nat Rev Immunol. 2015;15(3):172–184. - PubMed
    1. Victora GD, Nussenzweig MC. Germinal centers. Annu Rev Immunol. 2012;30:429–457. - PubMed
    1. Lohr JG, Stojanov P, Lawrence MS, et al. Discovery and prioritization of somatic mutations in diffuse large B-cell lymphoma (DLBCL) by whole-exome sequencing. Proc Natl Acad Sci USA. 2012;109(10):3879–3884. - PMC - PubMed
    1. Zhang J, Grubor V, Love CL, et al. Genetic heterogeneity of diffuse large B-cell lymphoma. Proc Natl Acad Sci USA. 2013;110(4):1398–1403. - PMC - PubMed
    1. Love C, Sun Z, Jima D, et al. The genetic landscape of mutations in Burkitt lymphoma. Nat Genet. 2012;44(12):1321–1325. - PMC - PubMed

Publication types

MeSH terms

Substances