. 2016 Mar 18;351(6279):1324-9.
doi: 10.1126/science.aaf1064.

C9orf72 is required for proper macrophage and microglial function in mice

Affiliations

C9orf72 is required for proper macrophage and microglial function in mice

J G O'Rourke et al. Science. .

Abstract

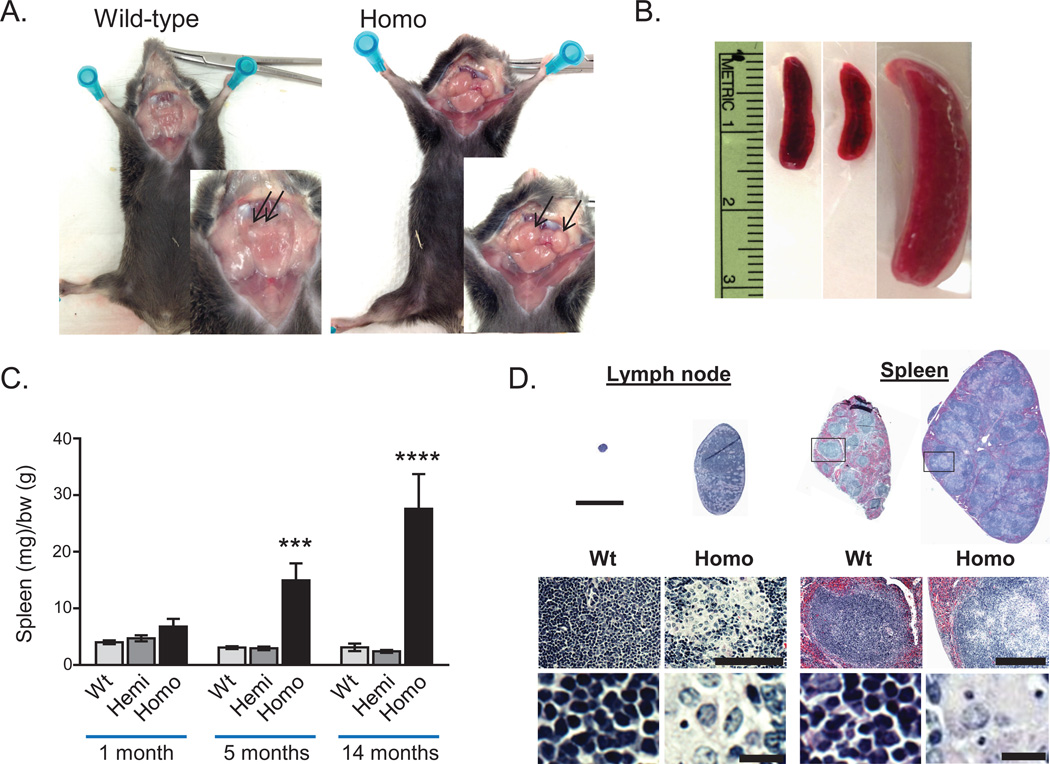
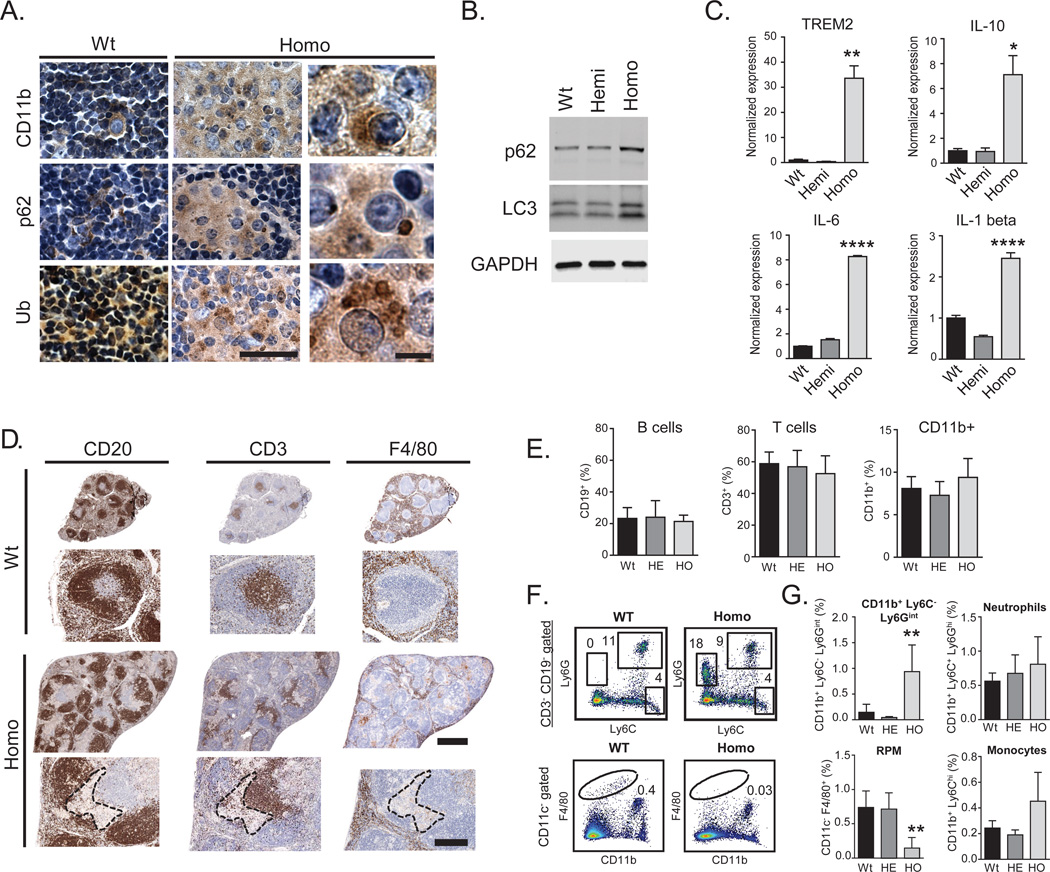
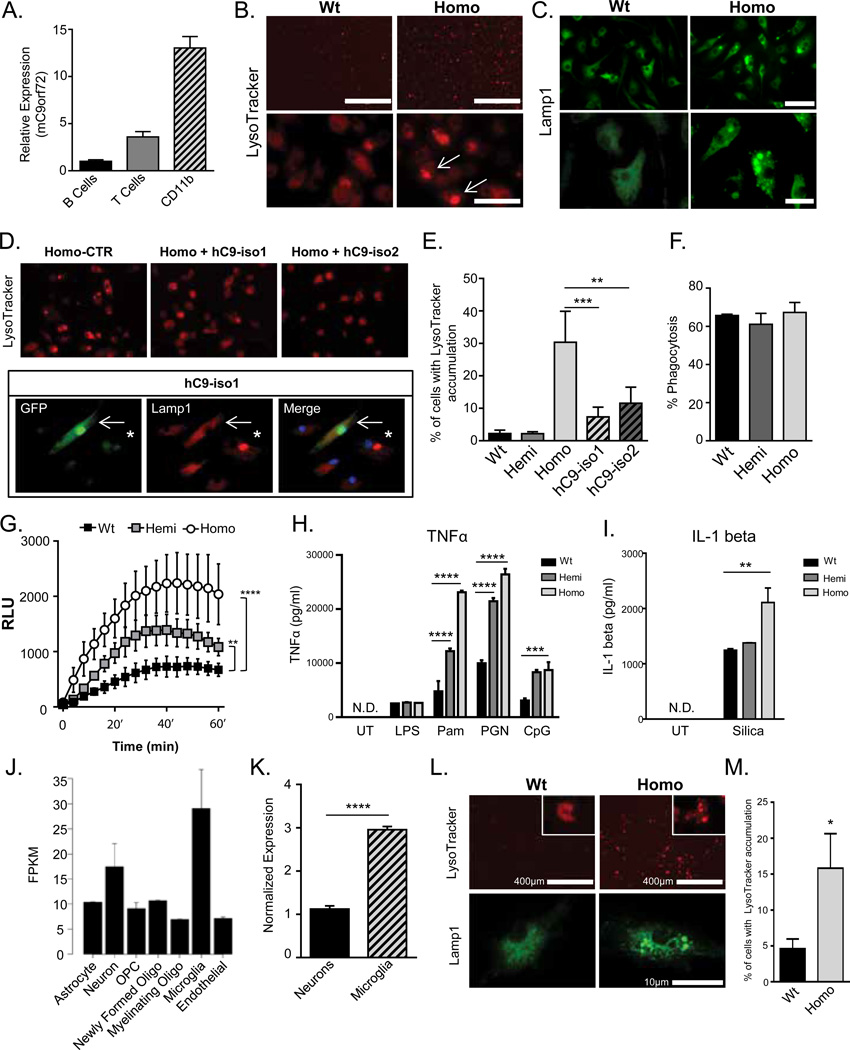
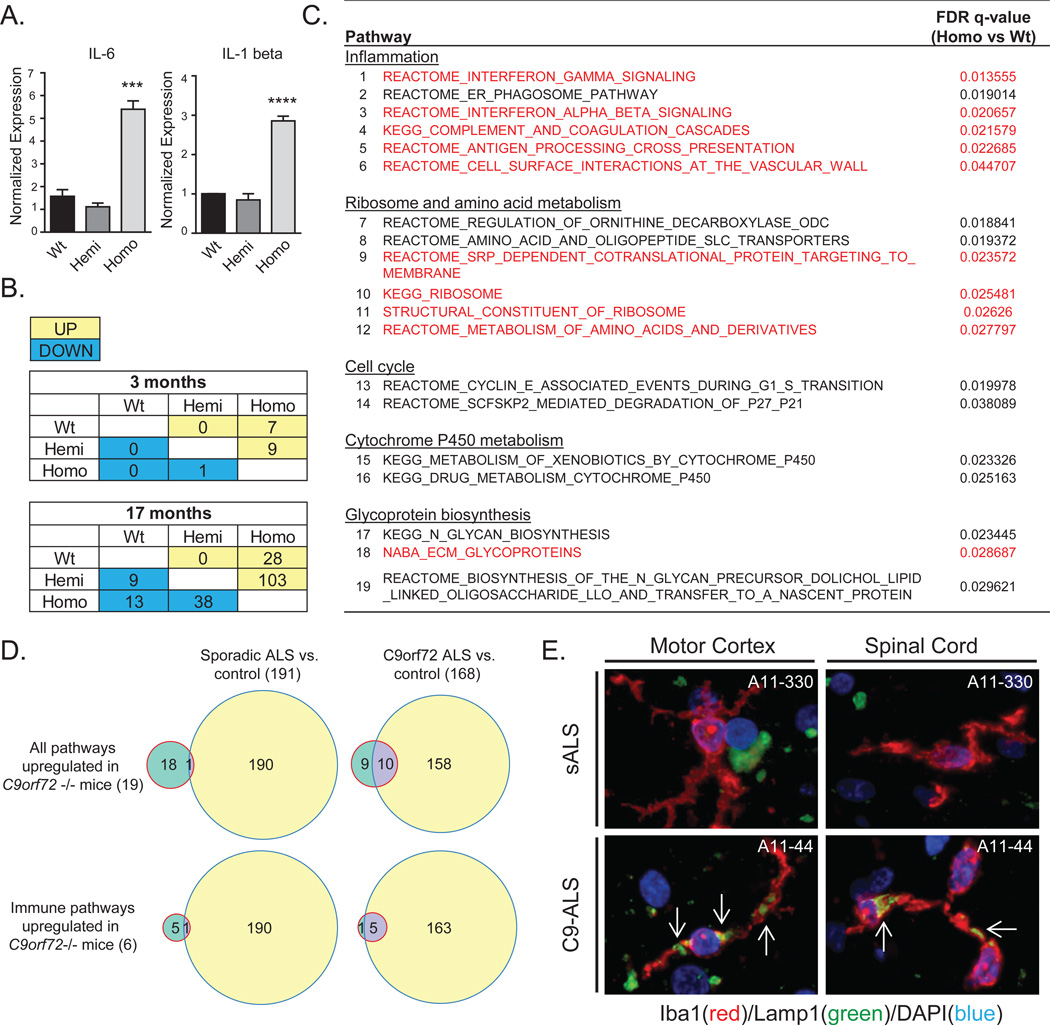
Expansions of a hexanucleotide repeat (GGGGCC) in the noncoding region of the C9orf72 gene are the most common genetic cause of amyotrophic lateral sclerosis (ALS) and frontotemporal dementia. Decreased expression of C9orf72 is seen in expansion carriers, suggesting that loss of function may play a role in disease. We found that two independent mouse lines lacking the C9orf72 ortholog (3110043O21Rik) in all tissues developed normally and aged without motor neuron disease. Instead, C9orf72 null mice developed progressive splenomegaly and lymphadenopathy with accumulation of engorged macrophage-like cells. C9orf72 expression was highest in myeloid cells, and the loss of C9orf72 led to lysosomal accumulation and altered immune responses in macrophages and microglia, with age-related neuroinflammation similar to C9orf72 ALS but not sporadic ALS human patient tissue. Thus, C9orf72 is required for the normal function of myeloid cells, and altered microglial function may contribute to neurodegeneration in C9orf72 expansion carriers.


Figures

Fig. 1
Fig. 1. Generation of C9orf72 (3110043O21Rik) null mice
(A) Gross images of cervical lymphadenopathy (arrows) in C9orf72−/− mice (9 months of age). (B) Gross images of splenomegaly (12 months of age). (C) Spleen weights (mg) normalized to body weight (g) at indicated ages (***p=0.0008, ****p<0.0001, two-way ANOVA). (D) H&E staining of wild-type and homozygote lymph nodes and spleens at 5 months (top; scale bar = 3 mm) showing disruption of follicular architecture in null mice by large cells with swollen cytoplasm (below). Scale bars = 100µm, 10µm (lymph node) and 300µm and 10µm (spleen).
Fig. 2
Fig. 2. C9orf72 null mice develop progressive splenomegaly with engorged macrophages, altered monocyte populations and inflammation
(A) Enlarged cells in homozygote spleens (5 months) stained for CD11b, and contained p62 and ubiquitin (Ub) accumulations. Scale bar = 100 µm and 20 µm. (B) Western blot of spleen lysates showed an increase in p62 and LC3 in C9orf72−/− mice (n=3; 14 months). (C) qRT-PCR analysis of spleens (14 months) showed an increase in macrophage marker Trem2 (**p=0.008), and cytokines IL-10 (*p = 0.035), IL-6 (****p<0.0001), and IL-1 beta (****p<0.0001; one-way ANOVA). (D) Immunostains of wild-type and C9orf72−/− spleens (5 months) for CD20 (B cells), CD3 (T cells), and F4/80 (red pulp macrophages). Dotted outline highlights region of abnormal CD11b+ cells in the C9orf72−/− spleens. Scale bar = 1mm and 300 µm. (E) FACS analysis of spleens (5 months). (F) Dot plots and (G) bar graphs showed a unique population of CD11b+ Ly6CLy6Gint cells in C9orf72−/− spleens, and a decrease in F4/80+ red pulp macrophages compared to wild-type or hemizygotes (n=4; 5 months) (**p=0.01, one-way ANOVA).
Fig. 3
Fig. 3. Analysis of macrophages and microglia from C9orf72 deficient mice
(A) qRT-PCR analysis from B cells, T cells, and CD11b+ cells FAC sorted from wild-type mouse spleen (n=2). (B,C) Bone marrow derived macrophages (BMDMs) from C9orf72−/− mice showed accumulation of LysoTracker and Lamp1 stained vesicles compared to wild-type (Wt). Scale bar = 50 µm and 20 µm. (D) C9orf72−/− BMDMs treated with lentivirus encoding either human C9orf72 isoform 1-IRES-GFP (hC9-iso1) or isoform 2-IRES-GFP (hC9-iso2). LysoTracker (top panel) or Lamp1(bottom panel) accumulation was rescued by either hC9-iso1 or hC9-iso2 (top panel). Arrow: hC9-iso1 infected cell; asterisk: uninfected cell. (E) Quantitation of LysoTracker accumulation in BMDMs of the indicated genotype, or homozygotes treated with hC9-iso1 and hC9-iso2 lentivirus. (***p=0.0002, **p=0.0018, one-way ANOVA). (F) BMDMs fed with fluorescent zymosan particles for 15 minutes and then analyzed by FACS analysis. (G) ROS production by BMDMs after zymosan ingestion in indicated genotypes (****p=<0.0001, two way ANOVA). (H) C9orf72+/− and C9orf72−/− BMDMs showed increased TNFα production after stimulation with Pam3CSK4 (Pam), peptidoglycan (PGN) and CpG, but not lipopolysaccharide (LPS) (****p<0.0001, ***p=0.0002, two way ANOVA. N.D. – not detected). (I) IL-1 beta production after stimulation with silica (*p<0.05, two-way ANOVA). (J) RNA-seq of C9orf72 in indicated cell types from the cerebral cortex (21). (K) qRT-PCR of C9orf72 from neurons and microglia isolated from adult mouse brain. (L) Microglia purified from C9orf72−/− mice showed accumulation of LysoTracker and Lamp1 positive enlarged vesicles. (M) Quantification of percentage of microglia with enlarged LysoTracker positive vesicles (*p=0.027, one-tailed t-test).
Fig. 4
Fig. 4. Neuroinflammation in C9orf72−/− mice and C9orf72 expansion patient tissue
(A) qRT-PCR of inflammatory cytokines (IL-6 and IL-1 beta) in microglia isolated from C9orf72−/− mice. (***p=0.0007; ****p=<0.0001, one-way ANOVA). (B) Tables showing the number of up and down-regulated pathways on GSEA (FDR<0.05) of RNA-seq from 3 and 17 month old lumbar spinal cords. (C) Table of up-regulated pathways in C9orf72−/− vs. C9orf72+/− and wild-type mouse spinal cords (FDR<0.05) at 17 months. Pathways up-regulated in both C9orf72−/− mice and human C9-ALS brain tissue are highlighted in red. (D) Top: Venn diagrams showing overlap between the 19 up-regulated pathways in C9orf72−/− mice from (C), and those up-regulated in cortex or cerebellum of sporadic ALS (left), or C9orf72 ALS (right). Bottom: Venn diagrams for the immune pathways from (C). (E) Human motor cortex and spinal cord from C9-ALS and sALS cases double-labelled with Iba1 (red) to identify microglia, and Lamp1 (green). Large accumulations of Lamp1 immunoreactivity (white arrows) were detected in activated microglia of C9-ALS but not sALS tissue.

Comment in

References

    1. Lomen-Hoerth C, Anderson T, Miller B. The overlap of amyotrophic lateral sclerosis and frontotemporal dementia. Neurology. 2002 Oct 8;59:1077. - PubMed
    1. Chen-Plotkin AS, Lee VM, Trojanowski JQ. TAR DNA-binding protein 43 in neurodegenerative disease. Nat Rev Neurol. 2010 Apr;6:211. - PMC - PubMed
    1. DeJesus-Hernandez M, et al. Expanded GGGGCC hexanucleotide repeat in noncoding region of C9ORF72 causes chromosome 9p-linked FTD and ALS. Neuron. 2011 Oct 20;72:245. - PMC - PubMed
    1. Renton AE, et al. A hexanucleotide repeat expansion in C9ORF72 is the cause of chromosome 9p21-linked ALS-FTD. Neuron. 2011 Oct 20;72:257. - PMC - PubMed
    1. Cooper-Knock J, Shaw PJ, Kirby J. The widening spectrum of C9ORF72-related disease; genotype/phenotype correlations and potential modifiers of clinical phenotype. Acta Neuropathol. 2014 Mar;127:333. - PMC - PubMed

Publication types

MeSH terms