. 2016 Feb 5;2(2):e1500882.
doi: 10.1126/sciadv.1500882. eCollection 2016 Feb.

Reorganization of chromosome architecture in replicative cellular senescence

Affiliations

Reorganization of chromosome architecture in replicative cellular senescence

Steven W Criscione et al. Sci Adv. .

Abstract

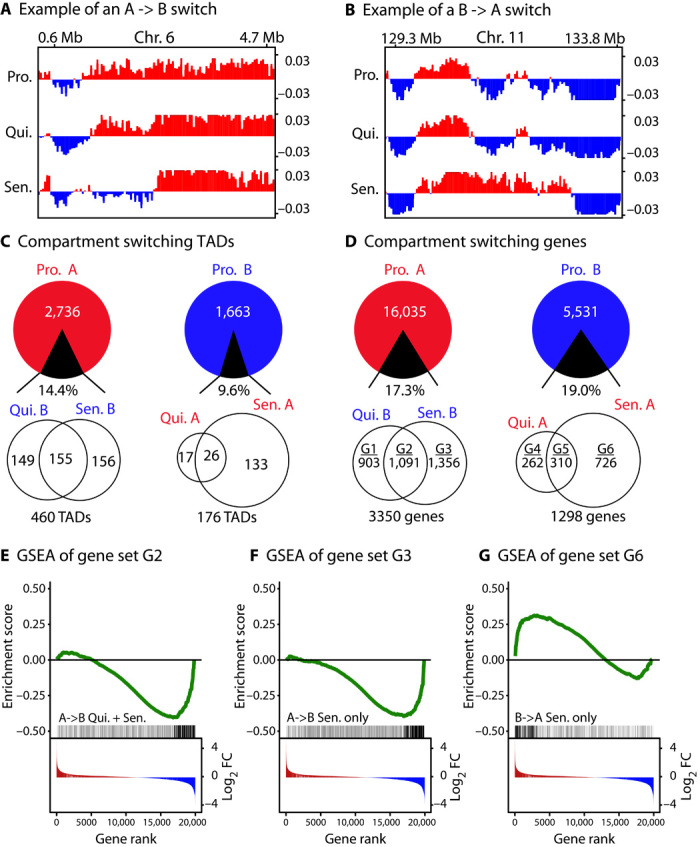
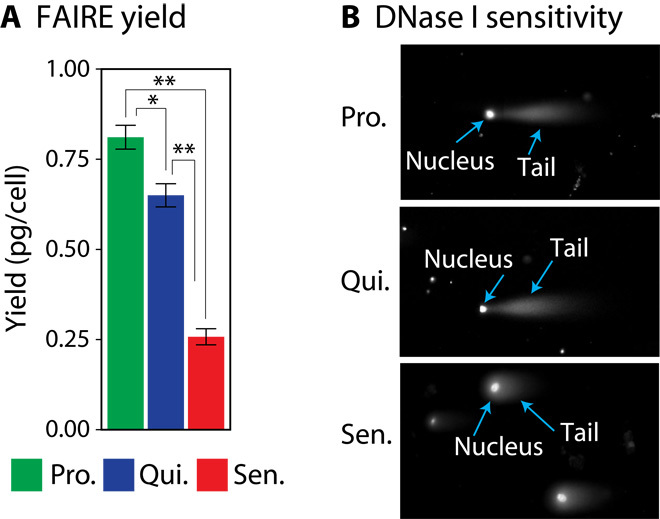
Replicative cellular senescence is a fundamental biological process characterized by an irreversible arrest of proliferation. Senescent cells accumulate a variety of epigenetic changes, but the three-dimensional (3D) organization of their chromatin is not known. We applied a combination of whole-genome chromosome conformation capture (Hi-C), fluorescence in situ hybridization, and in silico modeling methods to characterize the 3D architecture of interphase chromosomes in proliferating, quiescent, and senescent cells. Although the overall organization of the chromatin into active (A) and repressive (B) compartments and topologically associated domains (TADs) is conserved between the three conditions, a subset of TADs switches between compartments. On a global level, the Hi-C interaction matrices of senescent cells are characterized by a relative loss of long-range and gain of short-range interactions within chromosomes. Direct measurements of distances between genetic loci, chromosome volumes, and chromatin accessibility suggest that the Hi-C interaction changes are caused by a significant reduction of the volumes occupied by individual chromosome arms. In contrast, centromeres oppose this overall compaction trend and increase in volume. The structural model arising from our study provides a unique high-resolution view of the complex chromosomal architecture in senescent cells.

Keywords: DNA FISH; Hi-C; cellular senescence; centromere; chromatin; chromosome architecture; chromosome conformation capture; genome organization; long-range interactions; telomere.


Figures

Fig. 1
Fig. 1. Hi-C interactions matrices.
(A to C) Normalized heatmaps are shown for the q arm of chromosome 18 in proliferating, quiescent, and senescent cells. The color maps for relative interaction probability are displayed on the same scale for each heatmap. The PC1 signal was used to define the A and B compartments and is displayed below each heatmap (positive PC1 is shown in red and is designated as A compartments, and negative PC1 is shown in blue and is designated as B compartments). (D to F) Differential heatmaps are shown for the q arm of chromosome 18 for the indicated conditions. The color maps are displayed on the same scale for each comparison. Red is used to designate enrichment in the first condition (senescent or quiescent cells), and blue depletion.
Fig. 2
Fig. 2. Quantitative comparison of short-range versus long-range contacts.
(A) Contact probability (Ps) was calculated as a function of genomic distance for interactions within individual chromosome arms across the whole genome. (B) The ratio of short-range (≤2 Mb) versus long-range (≥2 Mb) interactions (SVL) was calculated for each chromosome arm across the whole genome. The SVL is significantly higher in senescent cells compared to proliferating or quiescent cells (***P < 0.001).
Fig. 3
Fig. 3. Switching of TADs between A and B compartments.
(A) Genome Browser view showing an example of a TAD that switches from an A compartment (red, positive PC1 signal) in proliferating and quiescent cells to a B compartment (blue, negative PC1 signal) in senescent cells. (B) Example of TADs switching from a B compartment in proliferating and quiescent cells to an A compartment in senescent cells. (C) Genome-wide summary of TAD switching using proliferating cells as a reference point. Venn diagrams show the number of TADs switching between proliferating, quiescent, and senescent conditions. Left: A-to-B compartment switches. Right: B-to-A compartment switches. (D) Same as (C) but displaying the number of genes that switch compartments. G1 to G6 designate gene sets containing the genes within each Venn diagram compartment. (E) GSEA analysis of a microarray expression data set from proliferating and senescent cells (33) using our gene set G2 (A to B switch in both quiescent and senescent cells). Significant overrepresentation of genes down-regulated in senescent/quiescent cells is evident [<0.001 false discovery rate (FDR)]. (F) The same analysis with gene set G3 (A to B switch only in senescent cells) showed overrepresentation of genes down-regulated in senescent cells (<0.001 FDR). (G) The same analysis with gene set G6 (B to A switch only in senescent cells) showed a significant overrepresentation of genes up-regulated in senescent cells (0.003 FDR).
Fig. 4
Fig. 4. Physical distances between individual loci within a single chromosome arm.
(A) Four DNA-FISH probes (p1 to p4) were designed in the p arm of chromosome 4. Probes p1 and p3 are in nonadjacent A compartments, and p2 and p4 are in nonadjacent B compartments. Probes were chosen on the basis of strong A-A and B-B interactions in Hi-C data. (B) The schematic shows the 3D spatial relationship predicted by Hi-C for probes p2 and p4 (nonadjacent B compartments) and p3 (A compartment). (C) The distances between transcompartment (A-B) probes (p2-p3 and p3-p4) are significantly decreased in senescent cells (***P < 0.001). (D) Representative 3D DNA-FISH images of quiescent (upper panel) and senescent (lower panel) cells.
Fig. 5
Fig. 5. Assessment of relative chromatin accessibility.
(A) FAIRE experiments were performed on three separate occasions using cells in the indicated conditions as starting material. Yields of FAIRE extracted (soluble) DNA are shown as picogram per cell. Relative to input DNA, these values represent 12, 10, and 4%, respectively. Error bars show SDs (**P < 0.01; *P < 0.05). (B) DNase I sensitivity of intact nuclei was visualized using the comet assay.
Fig. 6
Fig. 6. Compaction of chromosomes in senescent cells.
(A) 3D chromosome painting of chromosomes 4 and 18 in quiescent and senescent cells. 3D renderings of Z stacks of images were generated with Imaris software. Representative nuclei are shown for each condition (quiescent, senescent) for chromosome 4 (top), chromosome 18 (middle), and both visualized in the same cells (bottom). (B) Chromosome volumes were calculated from the 3D renderings, and the resulting distributions of the volumes are shown as box plots. Chromosomes in senescent cells had a significantly smaller volume (***P < 0.001; **P < 0.01). (C) 3D modeling of chromosome 18 based on Hi-C contact probabilities and mean chromosome radii from chromosome painting as scaling factors. The colors designate A (red) and B (blue) compartment signals. (D) In the collapsing spring model, chromosome arms shrink in size as a consequence of an increased local compaction of the chromatin. Increased contact probability in TADs observed in senescent cells is consistent with a model in which the intra-TAD distances decrease more than the inter-TADs distances (d, intra-TAD distance; D, inter-TAD distance; q, quiescent; s, senescent). TADs are depicted here as spheres, shaded either red for A compartments or blue for B compartments.

References

    1. Jun J.-I., Lau L. F., The matricellular protein CCN1 induces fibroblast senescence and restricts fibrosis in cutaneous wound healing. Nat. Cell Biol. 12, 676–685 (2010). - PMC - PubMed
    1. Krizhanovsky V., Yon M., Dickins R. A., Hearn S., Simon J., Miething C., Yee H., Zender L., Lowe S. W., Senescence of activated stellate cells limits liver fibrosis. Cell 134, 657–667 (2008). - PMC - PubMed
    1. López-Otín C., Blasco M. A., Partridge L., Serrano M., Kroemer G., The hallmarks of aging. Cell 153, 1194–1217 (2013). - PMC - PubMed
    1. Muñoz-Espín D., Cañamero M., Maraver A., Gómez-López G., Contreras J., Murillo-Cuesta S., Rodríguez-Baeza A., Varela-Nieto I., Ruberte J., Collado M., Serrano M., Programmed cell senescence during mammalian embryonic development. Cell 155, 1104–1118 (2013). - PubMed
    1. Storer M., Mas A., Robert-Moreno A., Pecoraro M., Ortells M. C., Di Giacomo V., Yosef R., Pilpel N., Krizhanovsky V., Sharpe J., Keyes W. M., Senescence is a developmental mechanism that contributes to embryonic growth and patterning. Cell 155, 1119–1130 (2013). - PubMed

Publication types

LinkOut - more resources