

Phoneme and Word Scoring in Speech-in-Noise Audiometry
- PMID: 26989823
- PMCID: PMC4832875
- DOI: 10.1044/2016_AJA-15-0068
Phoneme and Word Scoring in Speech-in-Noise Audiometry
Abstract
Purpose: Understanding speech in background noise is difficult for many individuals; however, time constraints have limited its inclusion in the clinical audiology assessment battery. Phoneme scoring of words has been suggested as a method of reducing test time and variability. The purposes of this study were to establish a phoneme scoring rubric and use it in testing phoneme and word perception in noise in older individuals and individuals with hearing impairment.
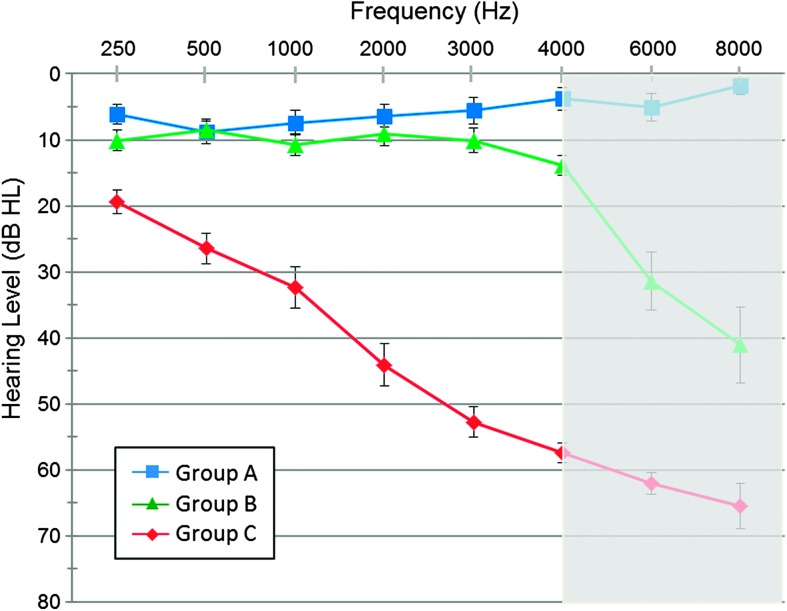
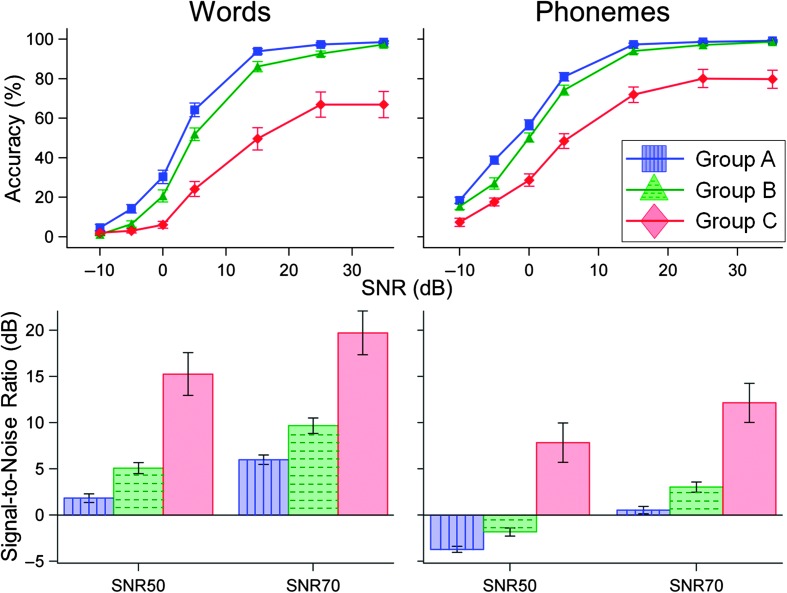
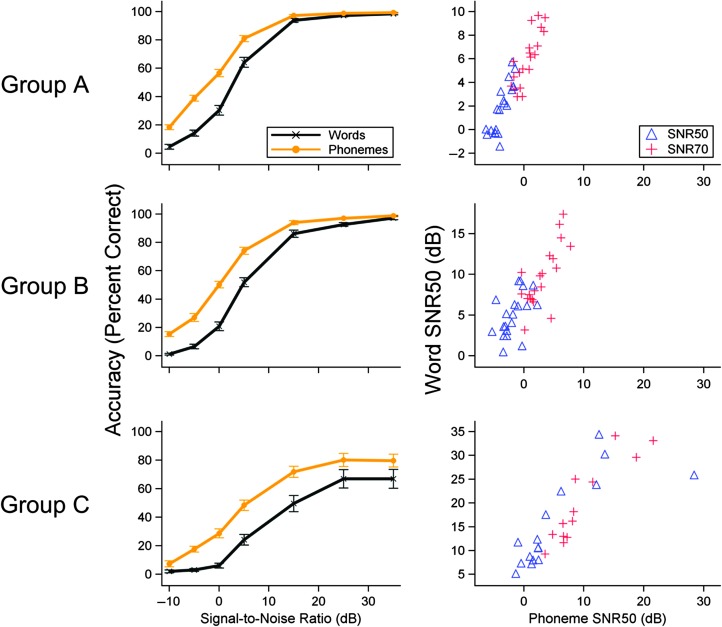
Method: Words were presented to 3 participant groups at 80 dB in speech-shaped noise at 7 signal-to-noise ratios (-10 to 35 dB). Responses were scored for words and phonemes correct.
Results: It was not surprising to find that phoneme scores were up to about 30% better than word scores. Word scoring resulted in larger hearing loss effect sizes than phoneme scoring, whereas scoring method did not significantly modify age effect sizes. There were significant effects of hearing loss and some limited effects of age; age effect sizes of about 3 dB and hearing loss effect sizes of more than 10 dB were found.
Conclusion: Hearing loss is the major factor affecting word and phoneme recognition with a subtle contribution of age. Phoneme scoring may provide several advantages over word scoring. A set of recommended phoneme scoring guidelines is provided.
Figures
Similar articles
-
Word recognition for temporally and spectrally distorted materials: the effects of age and hearing loss.Ear Hear. 2012 May-Jun;33(3):349-66. doi: 10.1097/AUD.0b013e318242571c. Ear Hear. 2012. PMID: 22343546
-
Speech-in-noise measures: variable versus fixed speech and noise levels.Int J Audiol. 2012 Sep;51(9):708-12. doi: 10.3109/14992027.2012.684407. Epub 2012 May 28. Int J Audiol. 2012. PMID: 22640687
-
The Carhart Memorial Lecture, American Auditory Society, Salt Lake City, Utah 1996. Phoneme and word recognition for words in isolation and in sentences.Ear Hear. 1997 Jun;18(3):175-88. doi: 10.1097/00003446-199706000-00001. Ear Hear. 1997. PMID: 9201453
-
Speech audiometry in noise-exposed workers: the SRT-PTA relationship revisited.Audiology. 1999 Jan-Feb;38(1):30-43. doi: 10.3109/00206099909073000. Audiology. 1999. PMID: 10052834 Review.
-
Transducer Variability in Speech-in-Noise Testing: Considerations Related to Stimulus Bandwidth.Am J Audiol. 2024 Sep 3;33(3):1070-1076. doi: 10.1044/2024_AJA-24-00055. Epub 2024 Jul 12. Am J Audiol. 2024. PMID: 38995872 Review.
Cited by
-
Speech Recognition in Noise: Analyzing Phoneme, Syllable, and Word-Based Scoring Methods and Their Interaction with Hearing Loss.Diagnostics (Basel). 2025 Jun 26;15(13):1619. doi: 10.3390/diagnostics15131619. Diagnostics (Basel). 2025. PMID: 40647618 Free PMC article.
-
Characterizing correlations in partial credit speech recognition scoring with beta-binomial distributions.JASA Express Lett. 2024 Feb 1;4(2):025202. doi: 10.1121/10.0024633. JASA Express Lett. 2024. PMID: 38299983 Free PMC article.
-
Aging and Speech-in-Noise Perception.Indian J Otolaryngol Head Neck Surg. 2023 Sep;75(3):1579-1585. doi: 10.1007/s12070-023-03689-2. Epub 2023 Mar 21. Indian J Otolaryngol Head Neck Surg. 2023. PMID: 37636642 Free PMC article.
-
Rates, Indications, and Speech Perception Outcomes of Revision Cochlear Implantations.J Clin Med. 2021 Jul 21;10(15):3215. doi: 10.3390/jcm10153215. J Clin Med. 2021. PMID: 34361999 Free PMC article.
-
Automating Speech Audiometry in Quiet and in Noise Using a Deep Neural Network.Biology (Basel). 2025 Feb 12;14(2):191. doi: 10.3390/biology14020191. Biology (Basel). 2025. PMID: 40001959 Free PMC article.
References
-
- American National Standards Institute. (1991). Maximum permissible ambient noise levels for audiometric test rooms (ANSI S3.1-1991). New York, NY: Author.
-
- Bacon S. P., Opie J. M., & Montoya D. Y. (1998). The effects of hearing loss and noise masking on the masking release for speech in temporally complex backgrounds. Journal of Speech, Language, and Hearing Research, 41, 549–563. - PubMed
-
- Boothroyd A. (1968). Developments in speech audiometry. British Journal of Audiology, 2, 3–10.
-
- Boothroyd A. (2008). The performance/intensity function: An underused resource. Ear and Hearing, 29, 479–491. - PubMed
Publication types
MeSH terms
Grants and funding
LinkOut - more resources
Full Text Sources
Other Literature Sources
Miscellaneous
