. 2016 Apr 26;12(5):1638-52.
doi: 10.1039/c5mb00637f.

Metabolomic analysis of survival in carbohydrate pre-fed pigs subjected to shock and polytrauma

Affiliations

Metabolomic analysis of survival in carbohydrate pre-fed pigs subjected to shock and polytrauma

Nancy E Witowski et al. Mol Biosyst. .

Abstract

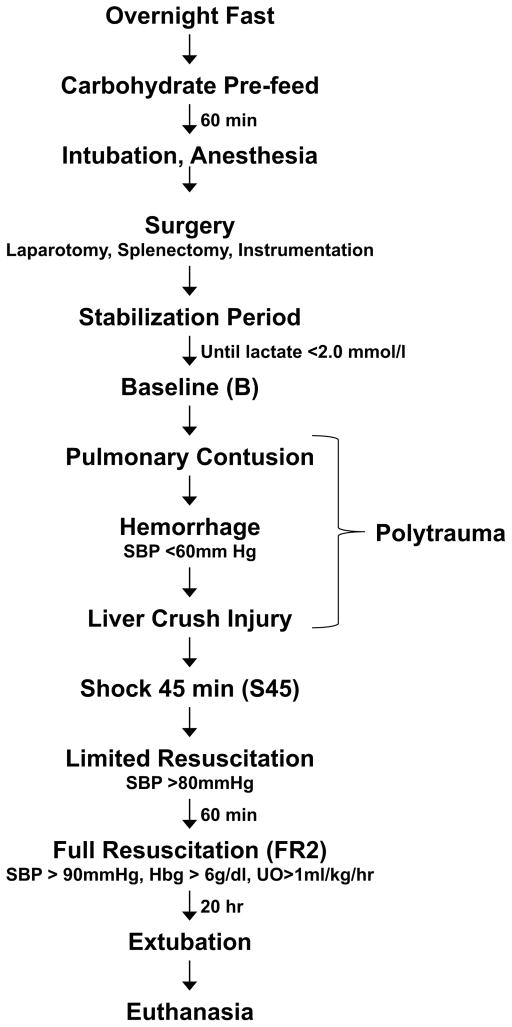
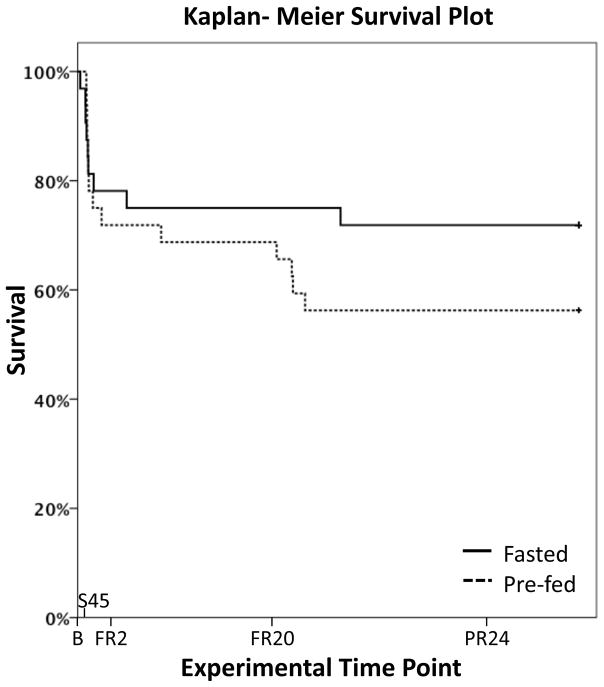
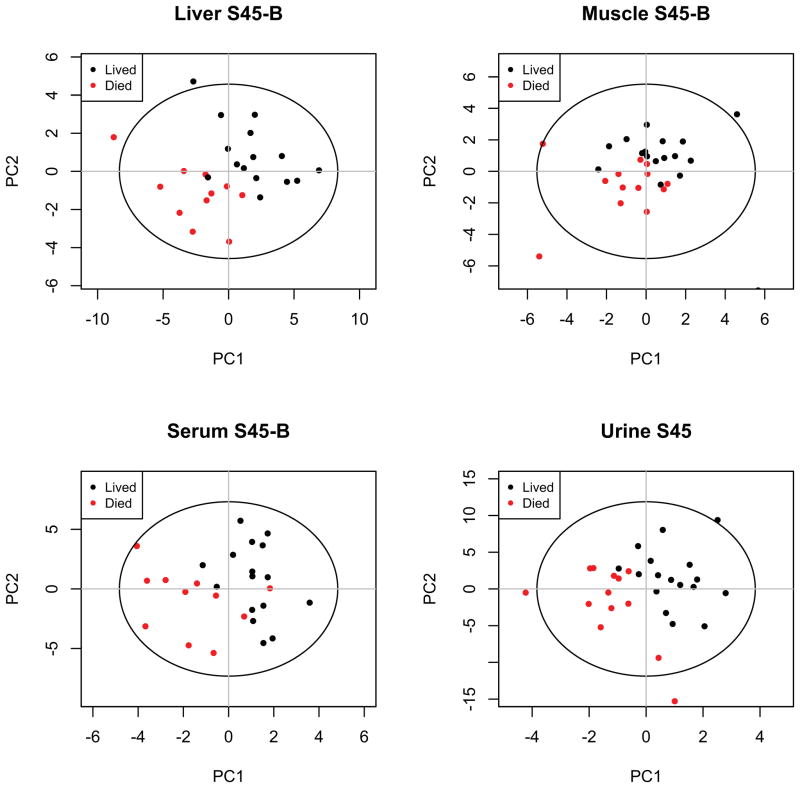
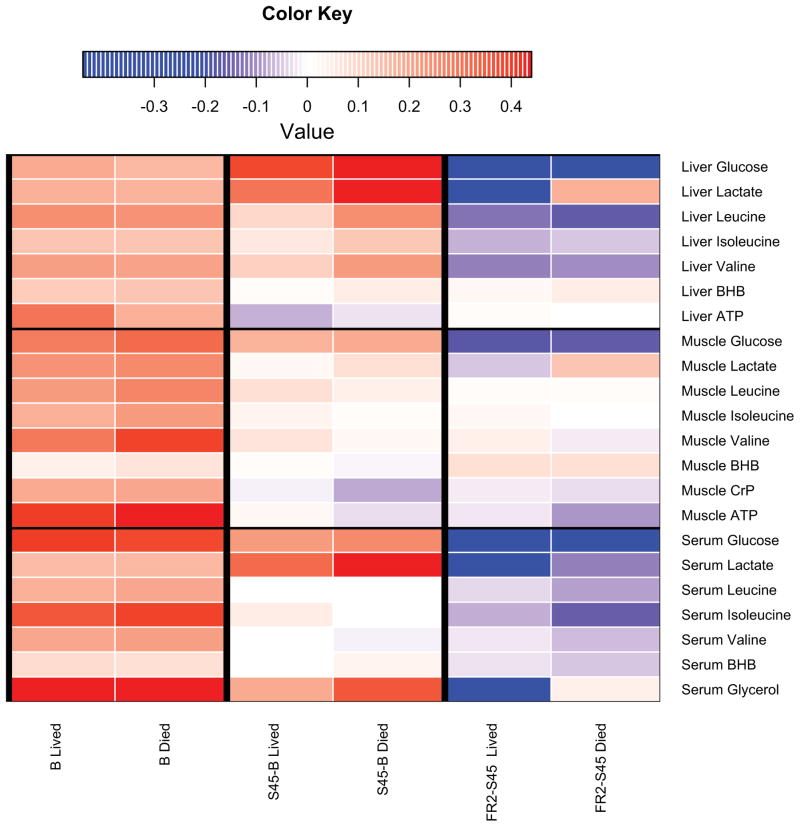
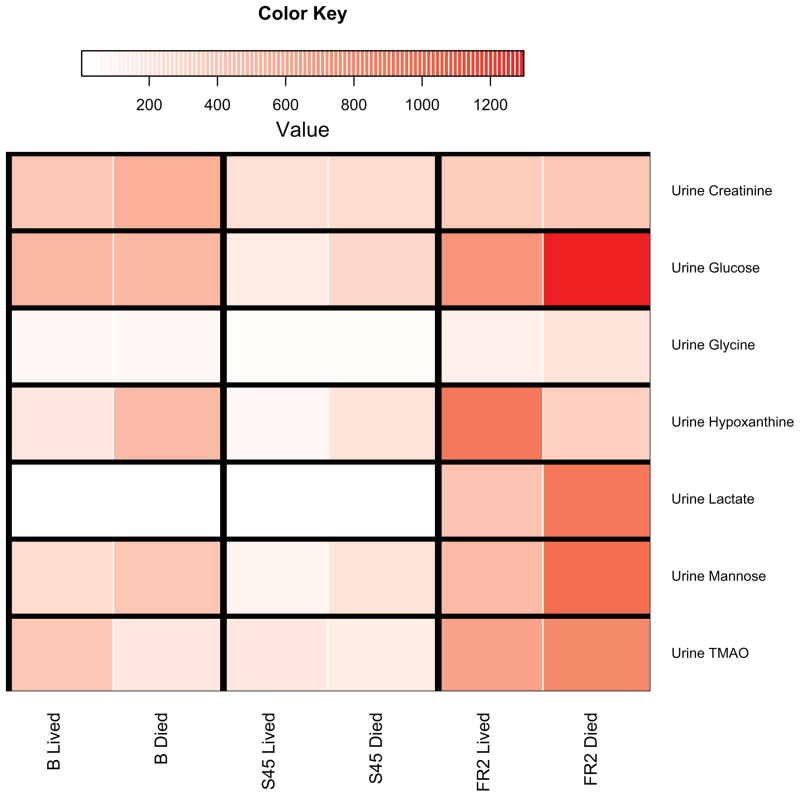
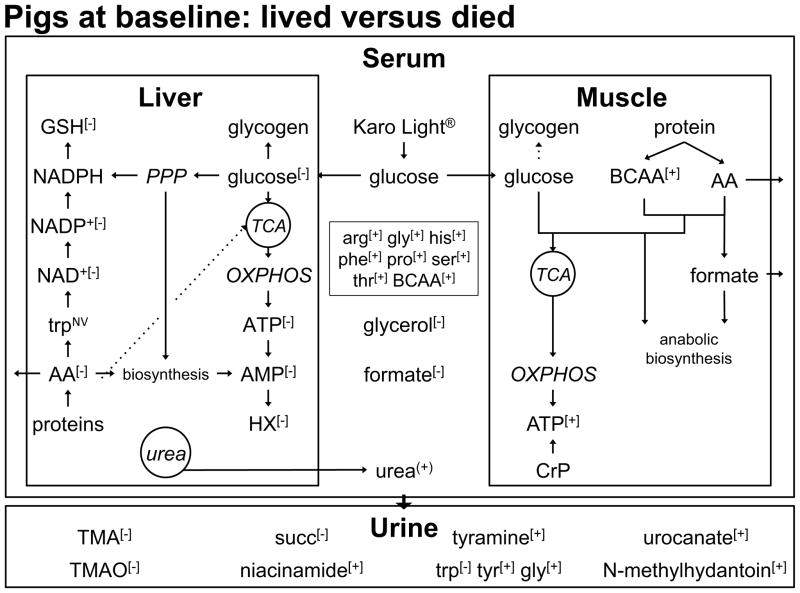
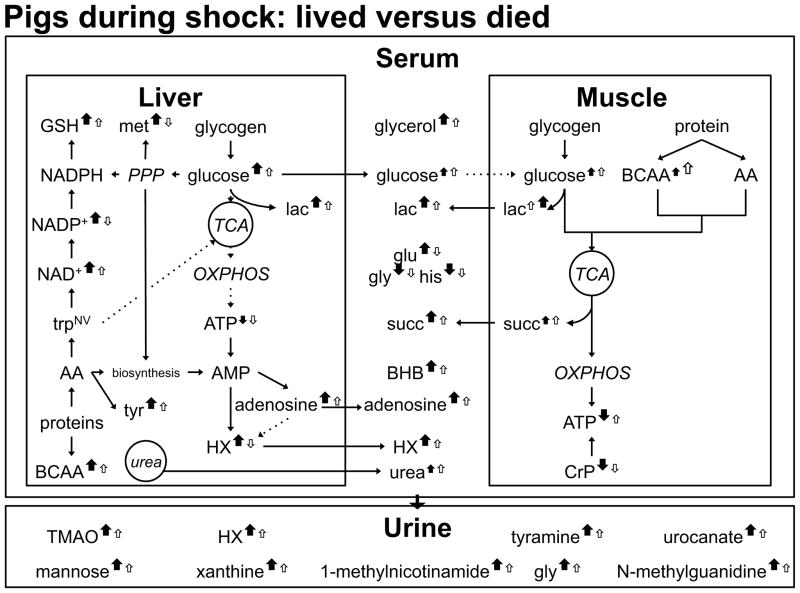
Hemorrhagic shock, a result of extensive blood loss, is a dominant factor in battlefield morbidity and mortality. Early rodent studies in hemorrhagic shock reported carbohydrate feeding prior to the induction of hemorrhagic shock decreased mortality. When repeated in our laboratory with a porcine model, carbohydrate pre-feed resulted in a 60% increase in death rate following hemorrhagic shock with trauma when compared to fasted animals (15/32 or 47% vs. 9/32 or 28%). In an attempt to explain the unexpected death rate for pre-fed animals, we further investigated the metabolic profiles of pre-fed non-survivors (n = 15) across 4 compartments (liver, muscle, serum, and urine) at specific time intervals (pre-shock, shock, and resuscitation) and compared them to pre-fed survivors (n = 17). As hypothesized, pre-fed pigs that died as a result of hemorrhage and trauma showed differences in their metabolic and physiologic profiles at all time intervals and in all compartments when compared to pre-fed survivors. Our data suggest that, although all animals were subjected to the same shock and trauma protocol, non-survivors exhibited altered carbohydrate processing as early as the pre-shock sampling point. This was evident in (for example) the higher levels of ATP and markers of greater anabolic activity in the muscle at the pre-shock time point. Based on the metabolic findings, we propose two mechanisms that connect pre-fed status to a higher death rate: (1) animals that die are more susceptible to opening of the mitochondrial permeability transition pore, a major factor in ischemia/reperfusion injury; and (2) loss of fasting-associated survival mechanisms in pre-fed animals.


Figures

Figure 1
Figure 1. Graphical Representation of Experimental Timeline
Tissue and fluid sampling time points are shown in parentheses (B, S45, FR2). SBP, systolic blood pressure; Hbg, blood hemoglobin; UO, urine output.
Figure 2
Figure 2. Forty-eight Hour Survival in Fasted and Pre-fed Pigs after Polytrauma and Resuscitation
There was a trend towards increased mortality in animals receiving a carbohydrate feed 60 minutes before surgery when compared to fasted animals (15/32 or 47% vs 9/32 or 28%, p=0.153). FR20, 20 hours after beginning of full resuscitation; PR24, 24 hours after end of full resuscitation. Figure modified from Colling et al., Shock, 2015 .
Figure 3
Figure 3. PLS-DA Scores Plots for the Shock Interval
PLS-DA scores plots show model discrimination between outcome groups during the response to shock in each of the four compartments (liver, muscle, serum, urine). Models are of varying quality and statistical significance as reported in Table 1. PC, principal component.
Figure 4
Figure 4. Heat Maps of Select Fuel Metabolites
4A: Heat maps highlight differences in fuel metabolites (liver, muscle, serum) for each time interval discussed, according to survival. This figure is meant to be a visual guide for the reader to quickly assess differences in fuel metabolites discussed at the beginning of each compartment’s subsection in the results. Colors indicate the scaled increase or decrease in metabolite abundance. Baseline columns reflect the scaled abundance of the metabolite at baseline. Subsequent columns show the scaled increase or decrease in metabolite abundance. Red indicates an increase and blue indicates a decrease. BHB, β-hydroxybutyrate. 4B: Heatmaps highlight differences in significant urinary metabolites for each time point discussed, according to survival. Scaled metabolite abundances are shown in red, with darker shades of red indicating higher levels of the metabolite. Individual time points are shown instead of time intervals as in Figure 3A because urine metabolite levels are expressed in terms of hourly urine output (nanomoles of metabolite per hour per kg). TMAO, trimethylamine N-oxide.
Figure 5
Figure 5. Baseline Metabolite Profile Comparing Non-survivors to Survivors
The level of muscle ATP, a downstream indicator of glucose provision, was greater in non-survivors. The level of formate, a 1-carbon unit involved in anabolic biosynthesis, was also higher in animals that died. Higher levels of branched-chain (BCAA) and other amino acids (AA) in the muscle and serum of non-survivors support the hypothesis of an elevated degree of proteolysis in animals that died. In the anabolic environment created by glucose provision, these amino acids can be used as building blocks for other amino acids. The level of glucose was differentiating and lower in the liver of non-survivors and is reflected in a lower level of ATP level in pigs that died. In contrast to the muscle, the liver metabolite profile suggests that animals that died exhibited a lower degree of biosynthetic activity compared to animals that lived. This is evidenced by the lower levels of liver GSH, hypoxanthine (HX), AMP, NAD+ and NADP+ in non-survivors. All these metabolites arise from activity of the pentose phosphate pathway (PPP), the pathway involved in anabolic biosynthesis. The lower level of glycerol, our marker of lipid breakdown, in non-survivors suggests that the degree of lipolysis was lower in non-survivors at baseline. Various metabolites that reflect tissue patterns were observed in the serum and urine. OXPHOS, oxidative phosphorylation; TMA, trimethylamine. + = level of this metabolite was higher in non-survivors compared to survivors − = level of this metabolite was lower in non-survivors compared to survivors (+) = level of this metabolite was in higher in non-survivors compared to survivors with p= 0.09
Figure 6
Figure 6. ATP Degradation
ADP and AMP are early stage products of ATP hydrolysis. During an ischemic event such as hemorrhagic shock, AMP can be hydrolyzed to provide the vasodilator adenosine . Alternatively, AMP degradation results in the production of hypoxanthine , which is further metabolized to xanthine and then uric acid by xanthine dehydrogenase (XDH) or xanthine oxidase (XO) . Additionally, in pigs, uric acid is also be converted to allantoin and H2O2 enzymatically by uricase. Both uric acid and allantoin are excreted in the urine. During biosynthesis, AMP can be generated from ribose 5-phosphate, a product of the pentose phosphate pathway. IMP, inosine monophosphate.
Figure 7
Figure 7. S45-B Metabolite Profile Comparing Non-survivors to Survivors
A closed arrow represents non-survivors; an open arrow represents survivors. Up arrows represent an increase in the level of metabolite compared to baseline; down arrows represent a decrease in the level of metabolite compared to baseline. Larger arrows signify greater changes in the designated group for metabolites with VIP>1. Several fuel sources were mobilized to combat the effects of shock and injury. The level of muscle glucose increased over baseline in both groups but the change was not differentiating between outcomes. The level of lactate (lac) exhibited a similar increase but the increase from baseline was higher in non-survivors. The increase in muscle branched-chain amino acids was lower in non-survivors. The level of muscle ATP dropped from baseline in non-survivors despite a suggested increased use of creatine phosphate. The increase in the level of glucose was higher and differentiating in the liver of non-survivors and is hypothesized to arise from a greater degree of glycogen formation at baseline in non-survivors. Both outcome groups exhibited an increase over baseline in the level of liver lactate, but the increase was higher in non-survivors. The glucose and lactate changes in pigs that died were accompanied by a shift to the biosynthetic pattern observed at baseline in survivors: non-survivors exhibited a greater increase when compared to baseline in the levels of methionine, GSH, NAD+, and NADP+. Metabolic products from tissue processes were observed in the serum and urine. The more substantial increase in the serum succinate level over baseline in non-survivors represents a potential biomarker of shock mortality.

Similar articles

Cited by

References

    1. Eastridge BJ, Mabry RL, Seguin P, Cantrell J, Tops T, Uribe P, Mallett O, Zubko T, Oetjen-Gerdes L, Rasmussen TE, Butler FK, Kotwal RS, Holcomb JB, Wade C, Champion H, Lawnick M, Moores L, Blackbourne LH. J Trauma Acute Care Surg. 2012;73:S431–7. doi: 10.1097/TA.0b013e3182755dcc. - DOI - PubMed
    1. Xiao W, Mindrinos MN, Seok J, Cuschieri J, Cuenca AG, Gao H, Hayden DL, Hennessy L, Moore EE, Minei JP, Bankey PE, Johnson JL, Sperry J, Nathens AB, Billiar TR, West MA, Brownstein BH, Mason PH, Baker HV, Finnerty CC, Jeschke MG, Lopez MC, Klein MB, Gamelli RL, Gibran NS, Arnoldo B, Xu W, Zhang Y, Calvano SE, McDonald-Smith GP, Schoenfeld DA, Storey JD, Cobb JP, Warren HS, Moldawer LL, Herndon DN, Lowry SF, Maier RV, Davis RW, Tompkins RG. Inflammation, Host Response to Injury Large-Scale Collaborative Research Program. J Exp Med. 2011;208:2581–2590. doi: 10.1084/jem.20111354. - DOI - PMC - PubMed
    1. Knaus WA, Draper EA, Wagner DP, Zimmerman JE. Crit Care Med. 1985;13:818–829. - PubMed
    1. Baker SP, o’Neill B, Haddon W, Jr, Long WB. Journal of Trauma and Acute Care Surgery. 1974;14:187–196. - PubMed
    1. DUNHAM CM, SIEGEL JH, WEIRETER L, FABIAN M, GOODARZI S, GUADALUPI P, GETTINGS L, LINBERG SE, VARY TC. Crit Care Med. 1991;19:231–243. - PubMed

Publication types