Proteomic analysis of sheep primary testicular cells infected with bluetongue virus
- PMID: 26989863
- PMCID: PMC7168089
- DOI: 10.1002/pmic.201500275
Proteomic analysis of sheep primary testicular cells infected with bluetongue virus
Abstract
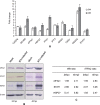
Bluetongue virus (BTV) causes a non-contagious, arthropod-transmitted disease in wild and domestic ruminants, such as sheep. In this study, we used iTRAQ labeling coupled with LC-MS/MS for quantitative identification of differentially expressed proteins in BTV-infected sheep testicular (ST) cells. Relative quantitative data were obtained for 4455 proteins in BTV- and mock-infected ST cells, among which 101 and 479 proteins were differentially expressed at 24 and 48 h post-infection, respectively, indicating further proteomic changes during the later stages of infection. Ten corresponding genes of differentially expressed proteins were validated via real-time RT-PCR. Expression levels of three representative proteins, eIF4a1, STAT1 and HSP27, were further confirmed via western blot analysis. Bioinformatics analysis disclosed that the differentially expressed proteins are primarily involved in biological processes related to innate immune response, signal transduction, nucleocytoplasmic transport, transcription and apoptosis. Several upregulated proteins were associated with the RIG-I-like receptor signaling pathway and endocytosis. To our knowledge, this study represents the first attempt to investigate proteome-wide dysregulation in BTV-infected cells with the aid of quantitative proteomics. Our collective results not only enhance understanding of the host response to BTV infection but also highlight multiple potential targets for the development of antiviral agents.
Keywords: BTV; Differential expression; Microbiology; Quantitative proteomics; iTRAQ.
© 2016 WILEY-VCH Verlag GmbH & Co. KGaA, Weinheim.
Figures


Similar articles
-
MicroRNA expression profiling of primary sheep testicular cells in response to bluetongue virus infection.Infect Genet Evol. 2017 Apr;49:256-267. doi: 10.1016/j.meegid.2017.01.029. Epub 2017 Jan 27. Infect Genet Evol. 2017. PMID: 28132926
-
Whole-transcriptome analyses of sheep embryonic testicular cells infected with the bluetongue virus.Front Immunol. 2022 Dec 1;13:1053059. doi: 10.3389/fimmu.2022.1053059. eCollection 2022. Front Immunol. 2022. PMID: 36532076 Free PMC article.
-
A low-passage insect-cell isolate of bluetongue virus uses a macropinocytosis-like entry pathway to infect natural target cells derived from the bovine host.J Gen Virol. 2019 Apr;100(4):568-582. doi: 10.1099/jgv.0.001240. Epub 2019 Mar 7. J Gen Virol. 2019. PMID: 30843784
-
Interferon α/β receptor knockout mice as a model to study bluetongue virus infection.Virus Res. 2014 Mar;182:35-42. doi: 10.1016/j.virusres.2013.09.038. Epub 2013 Oct 4. Virus Res. 2014. PMID: 24100234 Review.
-
Functional mapping of bluetongue virus proteins and their interactions with host proteins during virus replication.Cell Biochem Biophys. 2008;50(3):143-57. doi: 10.1007/s12013-008-9009-4. Epub 2008 Feb 26. Cell Biochem Biophys. 2008. PMID: 18299997 Review.
Cited by
-
ISG20 inhibits bluetongue virus replication.Virol Sin. 2022 Aug;37(4):521-530. doi: 10.1016/j.virs.2022.04.010. Epub 2022 May 2. Virol Sin. 2022. PMID: 35513266 Free PMC article.
-
iTRAQ-based Proteomic Analysis of Porcine Kidney Epithelial PK15 cells Infected with Pseudorabies virus.Sci Rep. 2017 Apr 4;7:45922. doi: 10.1038/srep45922. Sci Rep. 2017. PMID: 28374783 Free PMC article.
-
iTRAQ-Based Quantitative Proteome Revealed Metabolic Changes in Winter Turnip Rape (Brassica rapa L.) under Cold Stress.Int J Mol Sci. 2018 Oct 26;19(11):3346. doi: 10.3390/ijms19113346. Int J Mol Sci. 2018. PMID: 30373160 Free PMC article.
-
iTRAQ-based high-throughput proteomics analysis reveals alterations of plasma proteins in patients infected with human bocavirus.PLoS One. 2019 Nov 21;14(11):e0225261. doi: 10.1371/journal.pone.0225261. eCollection 2019. PLoS One. 2019. PMID: 31751365 Free PMC article.
-
Interferon-stimulated gene 15 facilitates BTV replication through interacting with the NS1 protein.Front Microbiol. 2023 Aug 11;14:1212242. doi: 10.3389/fmicb.2023.1212242. eCollection 2023. Front Microbiol. 2023. PMID: 37637123 Free PMC article.
References
-
- Mellor, P. S. , Boorman, J. , The transmission and geographical spread of African horse sickness and bluetongue viruses. Ann. Trop. Med. Parasitol. 1995, 89, 1–15. - PubMed
-
- Maclachlan, N. J. , Drew, C. P. , Darpel, K. E. , Worwa, G. , The pathology and pathogenesis of bluetongue. J. Comp. Pathol. 2009, 141, 1–16. - PubMed
-
- OIE , Manual of Diagnostic Tests and Vaccines for Terrestrial Animals, 7th Edition, Paris: 2012.
-
- Roy, P. , Functional mapping of bluetongue virus proteins and their interactions with host proteins during virus replication. Cell Biochem. Biophys. 2008, 50, 143–157. - PubMed
Publication types
MeSH terms
Substances
LinkOut - more resources
Full Text Sources
Other Literature Sources
Research Materials
Miscellaneous

