. 2016 May;157(5):1789-98.
doi: 10.1210/en.2015-1965. Epub 2016 Mar 18.

Pasireotide Therapy of Multiple Endocrine Neoplasia Type 1-Associated Neuroendocrine Tumors in Female Mice Deleted for an Men1 Allele Improves Survival and Reduces Tumor Progression

Affiliations

Pasireotide Therapy of Multiple Endocrine Neoplasia Type 1-Associated Neuroendocrine Tumors in Female Mice Deleted for an Men1 Allele Improves Survival and Reduces Tumor Progression

Gerard V Walls et al. Endocrinology. 2016 May.

Abstract

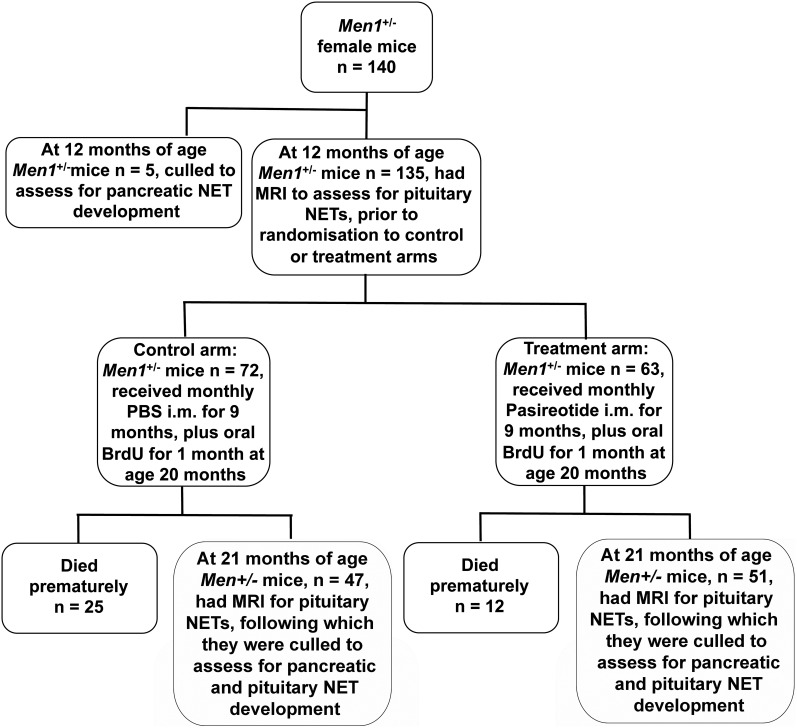
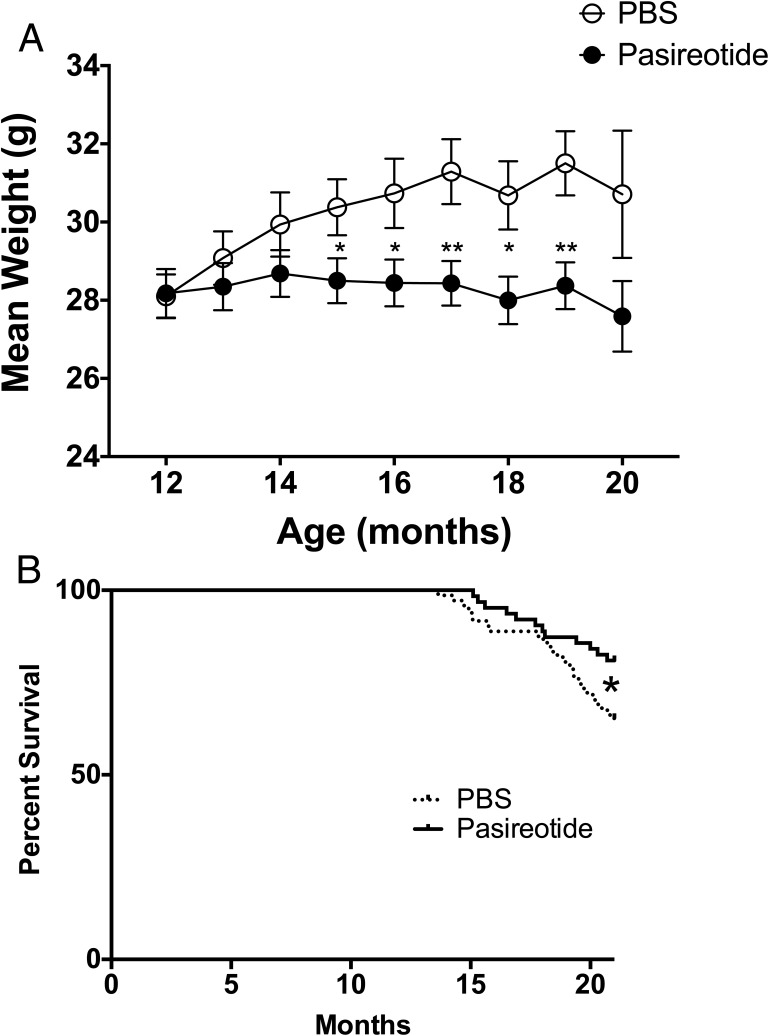
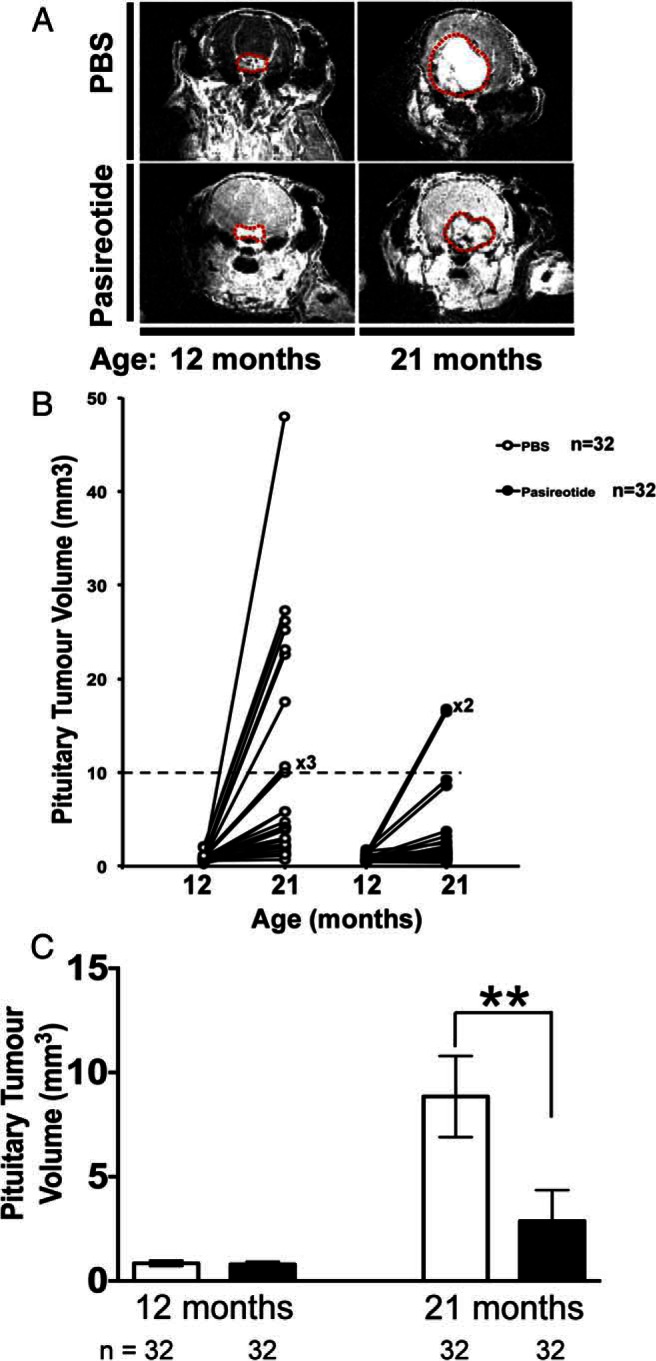
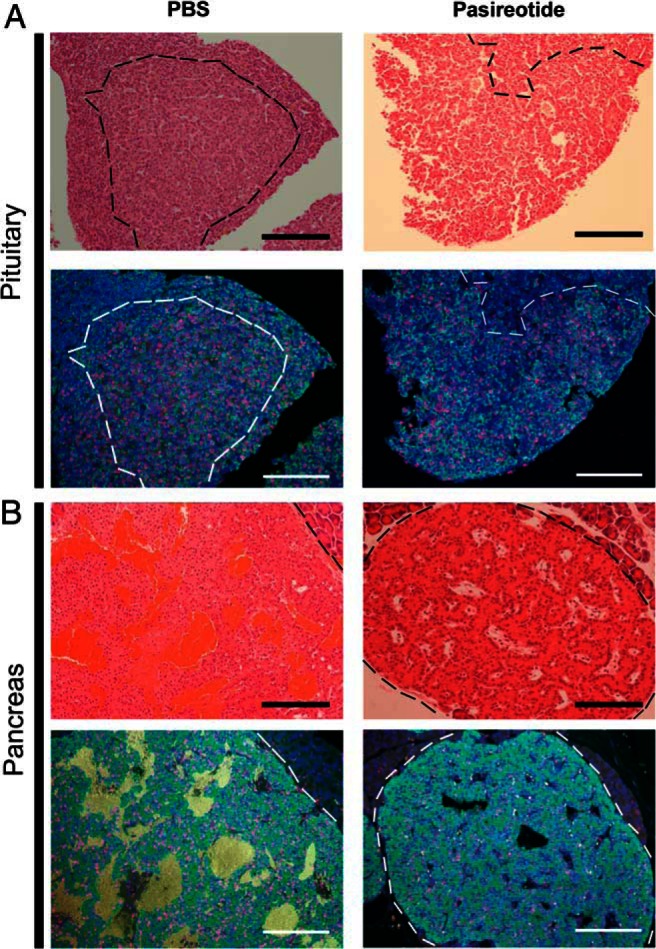
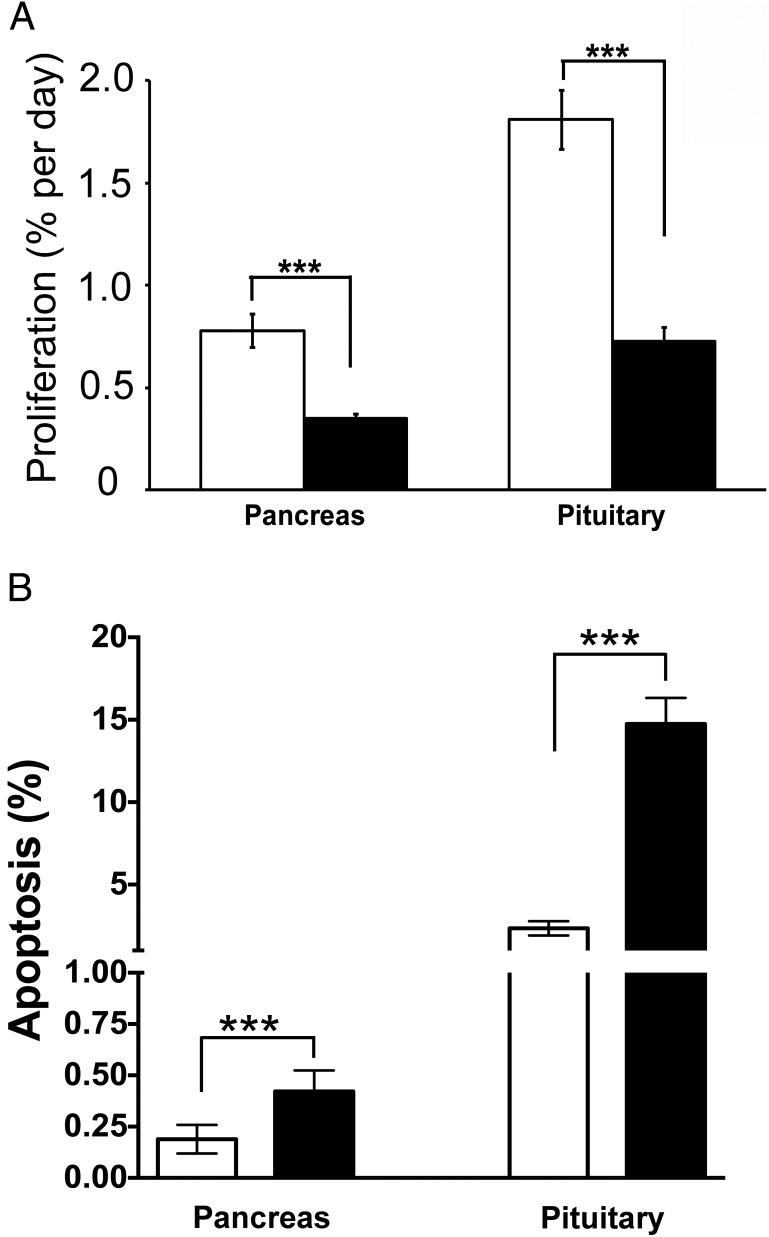
Pasireotide, a somatostatin analog, is reported to have anti-proliferative effects in neuroendocrine tumors (NETs). We therefore assessed the efficacy of pasireotide for treating pancreatic and pituitary NETs that develop in a mouse model of multiple endocrine neoplasia type 1 (MEN1). Men1(+/-) mice were treated from age 12 mo with 40 mg/kg pasireotide long-acting release formulation, or PBS, intramuscularly monthly for 9 mo. The Men1(+/-) mice had magnetic resonance imaging at 12 and 21 mo, and from 20 mo oral 5-bromo-2-deoxyuridine for 1 mo, to assess tumor development and proliferation, respectively. NETs were collected at age 21 mo, and proliferation and apoptosis assessed by immunohistochemistry and TUNEL assays, respectively. Pasireotide-treated Men1(+/-) mice had increased survival (pasireotide, 80.9% vs PBS, 65.2%; P < .05), with fewer mice developing pancreatic NETs (pasireotide, 86.9% vs PBS, 96.9%; P < .05) and smaller increases in pituitary NET volumes (pre-treated vs post-treated, 0.803 ± 0.058 mm(3) vs 2.872 ± 0.728 mm(3) [pasireotide] compared with 0.844 ± 0.066 mm(3) vs 8.847 ±1.948 mm(3) [PBS]; P < .01). In addition, pasireotide-treated mice had fewer pancreatic NETs compared with PBS-treated mice (2.36 ± 0.25 vs 3.72 ± 0.32, respectively; P < .001), with decreased proliferation in pancreatic NETs (pasireotide, 0.35 ± 0.03% vs PBS, 0.78 ± 0.08%; P < .0001) and pituitary NETs (pasireotide, 0.73 ±0.07% vs PBS, 1.81 ± 0.15%; P < .0001), but increased apoptosis in pancreatic NETs (pasireotide, 0.42 ± 0.05% vs PBS, 0.19 ± 0.03%; P < .001) and pituitary NETs (pasireotide, 14.75 ± 1.58% vs PBS, 2.35 ± 0.44%; P < .001). Thus, pasireotide increased survival and inhibited pancreatic and pituitary NET growth, thereby indicating its potential as an anti-proliferative and pro-apoptotic therapy.


Figures

Figure 1.
Figure 1.
Flowchart for the trial of pasireotide in the treatment of neuroendocrine tumors (NETs) of Men1+/− mice. Female Men1+/− mice (n = 140) were aged to 12 mo, and 5 Men1+/− mice (control nontreated 12-mo group) were culled to assess for the number of pancreatic NETs. The remaining 135 Men1+/− mice underwent MRI for assessment of pituitary NETs, and were randomly assigned to a control group given PBS (n = 72) or a treatment group given pasireotide (n = 63) for 9 mo. Mice were also given oral BrdU for 4 wk, commencing at age 20 mo. During the 9 mo from ages 12–21 mo, 25 Men1+/− mice from the PBS-treated group and 12 Men1+/− mice from the pasireotide-treated group died. Thus, 47 Men1+/− mice from the PBS-treated group and 51 Men1+/− mice from the pasireotide-treated group completed the study to age 21 mo, when the mice were reassessed using MRI for changes in pituitary NET volume prior to being culled. Pituitary and pancreatic NETs were collected at necropsy.
Figure 2.
Figure 2.
Immunohistochemical analysis of SSTR expression in pituitary and pancreatic NETs. A–D, pituitary NETs; and E-H, pancreatic NETs. A, Pituitary NET showing diffuse cytoplasmic SSTR1 staining in a large number of cells. B, Pituitary NET showing moderate SSTR2 staining of the plasma membrane in a subset of cells. C, Pituitary NET showing diffuse cytoplasmic SSTR3 staining in a minority of cells. D, Pituitary NET showing moderate cytoplasmic SSTR5 staining in a large number of cells. E, Pancreatic NET showing cytoplasmic SSTR1 staining. F, Pancreatic NET showing cytoplasmic SSTR2 staining. G, Pancreatic NET showing absence of SSTR3 staining. H, Pancreatic NET showing cytoplasmic SSTR5 staining in most islet cells. Thus, pituitary NETs show expression of SSTR1, 2, 3, and 5, whereas pancreatic NETs show expression of only SSTR1, 2, and 5. Magnification 100× for pituitary NETs and 200x for pancreatic NETs; inset magnification 400× for pituitary and pancreatic NETs. Scale bar = 100 μm.
Figure 3.
Figure 3.
Weight and survival in Men1+/− mice. A, Mean monthly weight of mice in the PBS-treated (open circles) and pasireotide-treated (closed circles) groups (n = 24–70). The pasireotide-treated Men1+/− mice did not gain weight when compared with the PBS-treated Men1+/− mice (*, P < .05; **, P < .01). Error bars represent SEM. B, Kaplan-Meier analysis of mortality rates in Men1+/− mice during the 21 mo of study. Forty-seven of 72 PBS-treated Men1+/− mice (65.2%) survived until age 21 mo, compared with 51 of 63 pasireotide-treated mice (80.9%). Thus, survival in pasireotide-treated Men1+/− mice was significantly higher at age 21 mo, compared with control PBS-treated Men1+/− mice (P < .05, log-rank Mantel-Cox test).
Figure 4.
Figure 4.
Pituitary NET imaging and volumetric measurements. A, Cranial MRI with gadolinium enhancement demonstrating pituitary NETs (outlined in red dotted line) in a PBS-treated (upper panels) Men1+/− mouse and a pasireotide-treated (lower panels) Men1+/− mouse at age 12 and 21 mo. B, MRI was used to assess pituitary NET volumes, pretreatment (12 mo) and 9 mo post-treatment (21 mo). The PBS-treated Men1+/− mice (n = 32) and pasireotide-treated Men1+/− mice (n = 32) had similarly sized pituitary NETs of approximately 0.3–3.0 mm3 at age 12 mo (baseline). However by age 21 mo, 10 of 32 of PBS-treated Men1+/− mice (31%) had developed large pituitary NETs of at least 10 mm3, whereas only two of 32 of Men1+/− mice (6.3%) treated with pasireotide had developed pituitary NETs with volumes at least 10 mm3. There was no evidence of pituitary NET development in the remaining 15 of 47 PBS-treated Men1+/− mice (31.9%) or 19 of pasireotide-treated Men1+/− mice 51 (37.3%) at age 21 mo, consistent with our previous observation that pituitary NETs only develop in a subset of female Men1+/− mice (29). C, The mean pituitary NET volumes at 12 mo in the PBS-treated (open bars) (n = 32) and pasireotide-treated (filled bars) (n = 32) Men1+/− mice were not significantly different (mean volume ± SEM of PBS-treated, 0.844 ± 0.066 mm3 vs pasireotide-treated, 0.803 ± 0.058 mm3). However, after 9 mo of treatment, at the age of 21 mo, the pasireotide-treated mice (n = 32) had a significantly smaller increase in pituitary NET volume when compared with the PBS-treated Men1+/− mice, such that the mean ± SEM pituitary tumor volume of the pasireotide-treated Men1+/− mice was 2.872 ± 0.728 mm3 compared with 8.847 ± 1.948 mm3 of the PBS-treated Men1+/− mice (**, P < .01). Error bars represent SEM.
Figure 5.
Figure 5.
Assessment by immunohistochemical analysis of effects of pasireotide on proliferation in Men1+/− mice pituitary NETs and pancreatic NETs. Pituitary and pancreatic NETs obtained from control PBS-treated Men1+/− mice are compared with pasireotide-treated Men1+/− mice, after administration of BrdU for 4 wk. A, Pituitary NET-adjacent sections from Men1+/− mice stained with H&E and immunostained for prolactin (green) and BrdU (red). Nuclei were counterstained with DAPI (Blue). The NETs are circled by dashed lines (black in the H&E sections and white in the fluorescent immunohistochemical sections). The large pituitary NETs from a PBS-treated Men1+/− mouse and a pasireotide-treated Men1+/− mouse showing immunostaining for prolactin but not GH (data not shown), are highly proliferating (red nuclei), although there are fewer proliferating cells in the pituitary NETs of the pasireotide-treated mouse. B, Pancreatic NET-adjacent sections from Men1+/− mice stained with H&E and immunostained for insulin (green) and BrdU (red), and counterstained for nuclei (blue). The NETs are circled by dashed lines (black in the H&E sections and white in the fluorescent immunohistochemical sections). The pancreatic NET from the pasireotide-treated Men1+/− mouse had fewer proliferating cells. Scale bar = 100 μm.
Figure 6.
Figure 6.
Proliferation and apoptosis of pancreatic and pituitary NETs in Men1+/− mice. Proliferative and apoptotic rates were assessed by BrdU labeling and TUNEL assays, respectively. Pancreatic and pituitary NETs were collected from Men1+/− mice age 21 mo given BrdU for 28 d before necropsy. The proliferation and apoptotic rates were compared between PBS and pasireotide-treated mice. A, Proliferation rates in pancreatic and pituitary NETs from PBS-treated Men1+/− mice (open bars) (n = 36 sections from six mice) and pasireotide-treated Men1+/− mice (filled bars) (n = 36 sections from six mice). B, Apoptotic rates in pancreatic and pituitary NETs from PBS-treated Men1+/− mice (open bars) (n = 19 pancreatic NET sections from three mice, and 40 pituitary NET sections from five mice) and pasireotide-treated Men1+/− mice (filled bars) (n = 21 pancreatic NET sections from five mice, and 39 pituitary NET sections from six mice). Pancreatic and pituitary NETs demonstrated a significant 4-fold increase in apoptosis with pasireotide treatment when compared with PBS-treatment. Error bars represent SEM; ***, P < .001.

References

    1. Yao JC, Hassan M, Phan A, et al. One hundred years after “carcinoid”: Epidemiology of and prognostic factors for neuroendocrine tumors in 35,825 cases in the United States. J Clin Oncol. 2008;26:3063–3072. - PubMed
    1. Daly AF, Rixhon M, Adam C, Dempegioti A, Tichomirowa MA, Beckers A. High prevalence of pituitary adenomas: A cross-sectional study in the province of Liege, Belgium. J Clin Endocrinol Metab. 2006;91:4769–4775. - PubMed
    1. Daly AF, Vanbellinghen JF, Khoo SK, et al. Aryl hydrocarbon receptor-interacting protein gene mutations in familial isolated pituitary adenomas: Analysis in 73 families. J Clin Endocrinol Metab. 2007;92:1891–1896. - PubMed
    1. Yates CJ, Newey PJ, Thakker RV. Challenges and controversies in management of pancreatic neuroendocrine tumours in patients with MEN1. Lancet Diabetes Endocrinol. 2015;3(11):895–905. - PubMed
    1. Yates CJ, Lines KE, Thakker RV. Molecular genetic advances in pituitary tumor development. Expert Rev Endocrinol Metab. 2015;10:35–53. - PubMed

Publication types

MeSH terms