. 2016 Aug;23(8):1322-30.
doi: 10.1038/cdd.2016.10. Epub 2016 Mar 18.

Identification of a novel agrin-dependent pathway in cell signaling and adhesion within the erythroid niche

Affiliations

Identification of a novel agrin-dependent pathway in cell signaling and adhesion within the erythroid niche

A Anselmo et al. Cell Death Differ. 2016 Aug.

Abstract

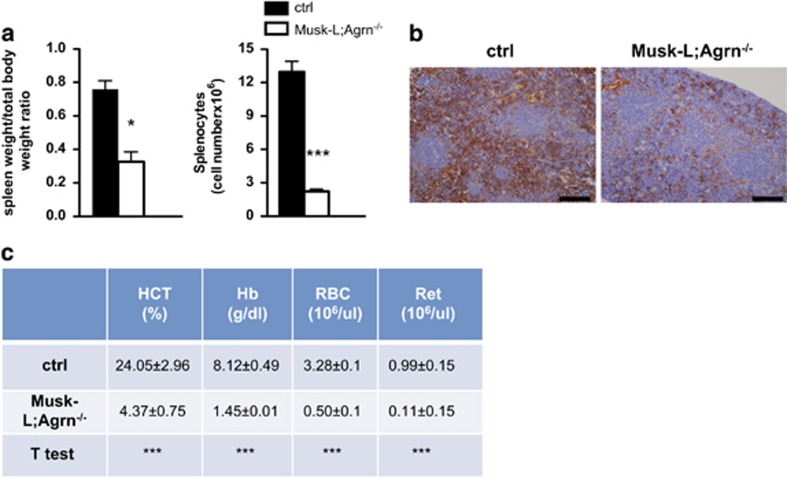
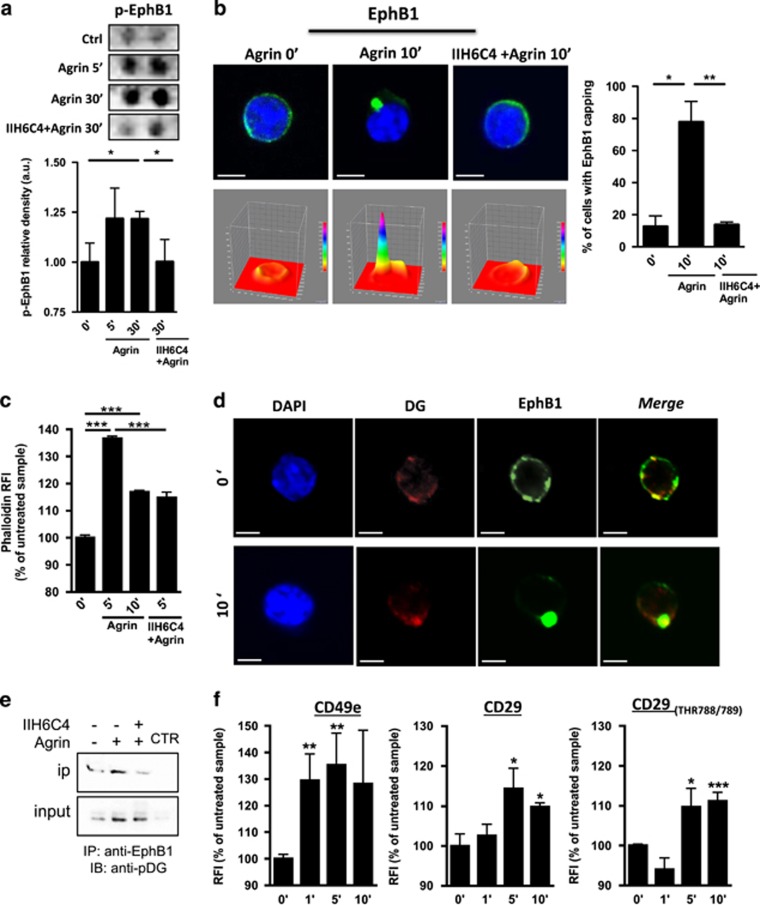
Establishment of cell-cell adhesion is crucial in embryonic development as well as within the stem cell niches of an adult. Adhesion between macrophages and erythroblasts is required for the formation of erythroblastic islands, specialized niches where erythroblasts proliferate and differentiate to produce red blood cells throughout life. The Eph family is the largest known family of receptor tyrosine kinases (RTKs) and controls cell adhesion, migration, invasion and morphology by modulating integrin and adhesion molecule activity and by modifying the actin cytoskeleton. Here, we identify the proteoglycan agrin as a novel regulator of Eph receptor signaling and characterize a novel mechanism controlling cell-cell adhesion and red cell development within the erythroid niche. We demonstrate that agrin induces clustering and activation of EphB1 receptors on developing erythroblasts, leading to the activation of α5β1 integrins. In agreement, agrin knockout mice display severe anemia owing to defective adhesion to macrophages and impaired maturation of erythroid cells. These results position agrin-EphB1 as a novel key signaling couple regulating cell adhesion and erythropoiesis.


Figures

Figure 1
Figure 1
Erythropoietic defects in agrin-deficient mice. (a) Musk-L;Agrn−/− ratio of the spleen weight/total body weight (left) and total splenocyte mean numbers relative to controls (right) at postnatal day 5 (P5) are shown. (ctrl: n=19, left;, n=12,right; Musk-L;Agrn−/−: n=10, left; n=7, right). In all panels, error bars represent S.E.M. (b) Representative immunohistochemical analysis of TER-119 on spleen sections of P5 control and agrin-deficient mice. Scale bar, 100 μm (c) Whole blood of control and Musk-L;Agrn−/− mice was analyzed using an automated hematology analyzer (ctrl, n=7; Musk-L;Agrn−/−, n=3). In all panels, error bars represent S.E.M. and *P⩽0.05, ***P⩽0.0001
Figure 2
Figure 2
Agrin is required for the maturation and survival of erythroid cells. (a) Representative flow cytometry analysis and confocal images of agrin and α-DG expression on the R1-R4 splenic erythroid subsets assessed by TER-119 and CD71 immunostaining. For flow cytometry experiments, the gray solid curve represents the isotype control. For confocal microscopy experiments, representative images are shown for a total of 30 cells analyzed for each gate (agrin or α-DG, green; nuclear DNA, blue; scale bar, 5 μm). (b) Total cell number in each splenic erythroid subset, as determined by flow cytometry, is expressed relative to controls (ctrl, n=10; Musk-L;Agrn−/−, n=7). (c) Flow cytometry analysis of Annexin-V staining in splenic erythroid subsets of control and agrin-deficient mice (ctrl, n=10; Musk-L;Agrn−/−, n=7). (d, e) Total bone marrow cells from either control or Musk-L;Agrn−/− P5, CD45.2 mice were transplanted into lethally irradiated CD45.1 recipients. After 9 weeks, the bone marrows of transplanted mice were analyzed by flow cytometry as specified: (d) MEP frequency among total bone marrow cells (left) and mean numbers relative to controls (right) (ctrl, n=4; Musk-L;Agrn−/−, n=8); (e) Erythroid subsets (R1-R4) analyzed by TER-119 and CD71 expression (mean numbers relative to controls; n=7). In (b–e) panels, error bars represent S.E.M. and *P⩽0.05, **P⩽0.01,***P⩽0.0001
Figure 3
Figure 3
Agrin orchestrates cell–cell interactions at the EI. (a, b) Analysis of erythroblastic islands (EI) in P5 control and agrin-deficient mice. Representative immunofluorescence confocal images of (a) native splenic EI and (b) bone marrow EI reconstituted with sorted F4/80+ macrophages and TER-119+ erythroid cells (F4/80, green; TER-119, red; scale bar 20 μm). Data shown are the mean of three pooled experiments (ctrl and Musk-L;Agrn−/−, n=3). (c, d, e) Analysis of reconstituted EI. (c) EI reconstituted with sorted F4/80+ control macrophages and TER-119+ erythroid cells from ctrl or Musk-L;Agrn−/− mice; data shown are the mean of two pooled experiments. (d) EI reconstituted with sorted control F4/80+ and TER-119+ cells incubated with the DG blocking antibody IIH6C4 or its isotype control (IgM). (e) EI reconstituted with sorted control F4/80+ macrophages, pre-incubated or not with the blocking antibody, and sorted TER-119+ erythroid control cells, pre-incubated or not with the blocking antibody. Data shown are the mean of two pooled experiments. In all panels (a–e), the number of TER-119+ cells per macrophage is indicated, error bars represent S.E.M. and ***P⩽0.0001
Figure 4
Figure 4
Agrin induces EphB1 phosphorylation in a DG–dependent manner. For experiments (a–d), primary sorted R2 erythroid cells from P5 ctrl mice were pre-incubated or not with the DG blocking antibody IIH6C4 (10 μg/ml) and stimulated with agrin (10 μg/ml) for the indicated time points. (a) EphB1 phosphorylation was determined using the mouse phosphor-RTK assay as described in methods. Histograms represent the fold increase in signal relative to unstimulated cells, and represent the mean of three pooled experiments. (b) Cell surface distribution of EphB1 was determined by staining with anti-EphB1 antibody (green) and DAPI (blue) and confocal microscopy analysis. Representative images and 3D surface plots are shown, scale bar, 5 μm. The percentage (± S.E.M.) of cells showing EphB1 capping was calculated (at least 30 cells from three independent experiments). (c) Induction of actin polymerization (phalloidin staining) was analyzed by flow cytometry. Results are reported as fold increase of the mean fluorescence intensity (MFI) of untreated samples. (d) Colocalization of EphB1 and DG was determined by staining with DG (red), EphB1 (green) and DAPI (blue), and corresponding images were merged (yellow). Shown are representative confocal images (out of 30 cells); scale bar, 5 μm. (e) K562 human erythromyeloblastoid cells pre-incubated or not with the IIH6C4 blocking antibody and stimulated for 10 min with agrin were lysed and the samples immunoprecipitated and subjected to WB analysis with the indicated antibodies; one representative experiment out of three is shown. (f) Flow cytometry analysis of CD29, CD49 membrane and CD29 (THR788/789) expression on the R2 erythroid subsets from P5 spleen of control mice stimulated for 1-5-10 min with agrin. Results are reported as fold increase of the MFI of untreated samples. Data shown are the mean of four pooled experiments. In all panels, error bars represent S.E.M. and *P⩽0.05, **P⩽0.01 and ***P⩽0.0001

References

    1. Bohme B, VandenBos T, Cerretti DP, Park LS, Holtrich U, Rubsamen-Waigmann H et al. Cell-cell adhesion mediated by binding of membrane-anchored ligand LERK-2 to the EPH-related receptor human embryonal kinase 2 promotes tyrosine kinase activity. J Biol Chem 1996; 271: 24747–24752. - PubMed
    1. Wang HU, Anderson DJ. Eph family transmembrane ligands can mediate repulsive guidance of trunk neural crest migration and motor axon outgrowth. Neuron 1997; 18: 383–396. - PubMed
    1. Palmer A, Klein R. Multiple roles of ephrins in morphogenesis, neuronal networking, and brain function. Genes Dev 2003; 17: 1429–1450. - PubMed
    1. Zhao C, Irie N, Takada Y, Shimoda K, Miyamoto T, Nishiwaki T et al. Bidirectional ephrinB2-EphB4 signaling controls bone homeostasis. Cell Metab 2006; 4: 111–121. - PubMed
    1. Wang Z, Miura N, Bonelli A, Mole P, Carlesso N, Olson DP et al. Receptor tyrosine kinase, EphB4 (HTK), accelerates differentiation of select human hematopoietic cells. Blood 2002; 99: 2740–2747. - PubMed

MeSH terms

LinkOut - more resources