. 2016 Jun;37(6):2161-72.
doi: 10.1002/hbm.23164. Epub 2016 Mar 16.

Multidimensional representation of odors in the human olfactory cortex

Affiliations

Multidimensional representation of odors in the human olfactory cortex

A Fournel et al. Hum Brain Mapp. 2016 Jun.

Abstract

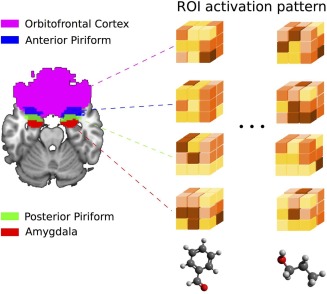
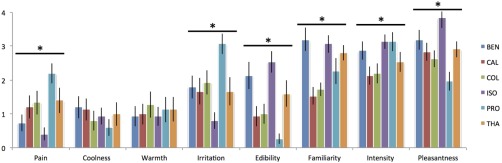
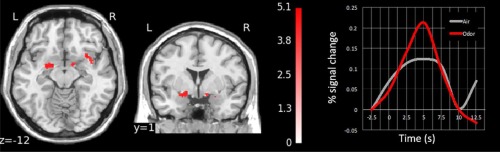
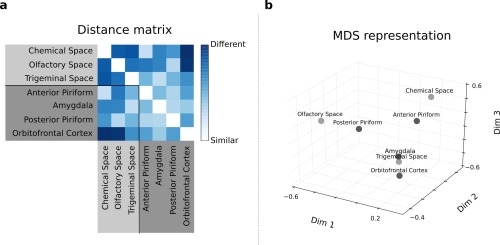
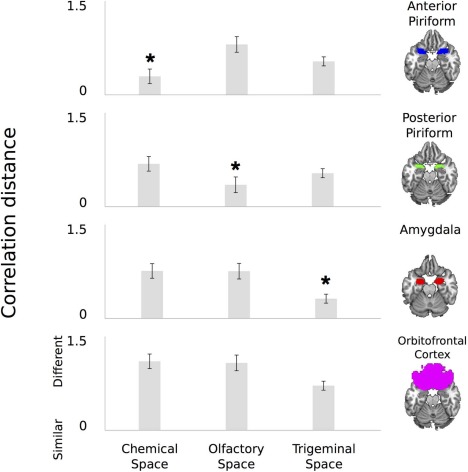
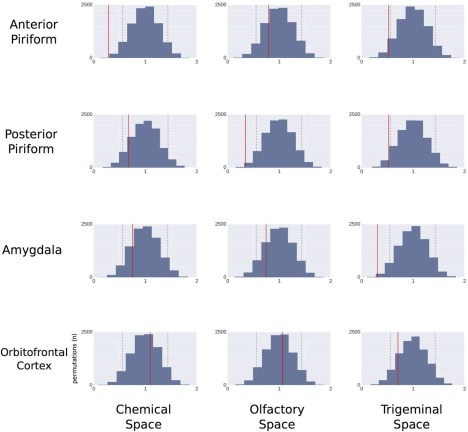
What is known as an odor object is an integrated representation constructed from physical features, and perceptual attributes mainly mediated by the olfactory and trigeminal systems. The aim of the present study was to comprehend how this multidimensional representation is organized, by deciphering how similarities in the physical, olfactory and trigeminal perceptual spaces of odors are represented in the human brain. To achieve this aim, we combined psychophysics, functional MRI and multivariate representational similarity analysis. Participants were asked to smell odors diffused by an fMRI-compatible olfactometer and to rate each smell along olfactory dimensions (pleasantness, intensity, familiarity and edibility) and trigeminal dimensions (irritation, coolness, warmth and pain). An event-related design was implemented, presenting different odorants. Results revealed that (i) pairwise odorant similarities in anterior piriform cortex (PC) activity correlated with pairwise odorant similarities in chemical properties (P < 0.005), (ii) similarities in posterior PC activity correlated with similarities in olfactory perceptual properties (P <0.01), and (iii) similarities in amygdala activity correlated with similarities in trigeminal perceptual properties (P < 0.01). These findings provide new evidence that extraction of physical, olfactory and trigeminal features is based on specific fine processing of similarities between odorous stimuli in a distributed manner in the olfactory system. Hum Brain Mapp 37:2161-2172, 2016. © 2016 Wiley Periodicals, Inc.

Keywords: amygdala; mental representation; piriform; similarity; smell; trigeminal.


Figures

Figure 1
Figure 1
Illustration of activation pattern extraction in the different regions of interest (ROI). [Color figure can be viewed in the online issue, which is available at http://wileyonlinelibrary.com.]
Figure 2
Figure 2
Perceptual ratings of the six chemosensory stimuli (PRO for propanol, ISO for isoamyl acetate, BEN for benzaldehyde, CAL for citronellal, COL for citronellol and THA for trans‐2‐hexenyl acetate). * means a significant effect of the odorant condition at the probability level of 5%. [Color figure can be viewed in the online issue, which is available at http://wileyonlinelibrary.com.]
Figure 3
Figure 3
Odor‐induced activations in piriform cortex, amygdala and OFC in coronal, and axial views (P < 0.001 uncorrected). The right panel depicts peri‐stimulus plot activity in piriform cortex. [Color figure can be viewed in the online issue, which is available at http://wileyonlinelibrary.com.]
Figure 4
Figure 4
(a) Distance matrix: each square element of this matrix represents the distance (1 minus Spearman correlation) between pairs of spaces. (b) MDS representation of the distance matrix depicted in (a): each point represents a particular space, and the distance between two points represents the degree of similarity between the spaces (the smaller the distance, the greater the similarity). [Color figure can be viewed in the online issue, which is available at http://wileyonlinelibrary.com.]
Figure 5
Figure 5
Correlation distances between neural spaces on the one hand, and chemical, olfactory and trigeminal spaces on the other hand. Error bars illustrate standard errors. * corresponds to a significant correlation at the corrected threshold of P < 0.05 (estimated by permutation tests). [Color figure can be viewed in the online issue, which is available at http://wileyonlinelibrary.com.]
Figure 6
Figure 6
Permutations distribution of correlation distances between neural spaces (anterior piriform, posterior piriform, amygdala, OFC) on the one hand, and chemical, olfactory and trigeminal spaces on the other hand. On each graph, dotted gray lines represent the 5% confidence interval. Solid lines illustrate real correlation distance values. [Color figure can be viewed in the online issue, which is available at http://wileyonlinelibrary.com.]
Figure 7
Figure 7
Representational Similarity Analysis in OFC sub‐regions. (a) Anatomical regions of interest in OFC (averaged across participants for visualization purposes; medial in green, posterior in purple, lateral in blue, anterior in red). (b) Distance matrix: each square element of this matrix represents the distance (1 minus Spearman correlation) between pairs of spaces. (c) MDS representation of the distance matrix depicted in (b): each point represents a particular space, and the distance between two points represents the degree of similarity between the spaces (the smaller the distance, the greater the similarity). [Color figure can be viewed in the online issue, which is available at http://wileyonlinelibrary.com.]
Figure 8
Figure 8
Procrustes analysis comparing odorant alignments in: (a) anterior piriform space vs. the chemical space, (b) posterior piriform space vs. the olfactory space, and (c) amygdala space vs. the trigeminal space. The histograms on the right side of the panels correspond to the permutation test distributions between neural spaces (anterior piriform, posterior piriform, amygdala, OFC) on the one hand, and chemical, olfactory and trigeminal spaces on the other hand. On each graph, dotted gray lines represents the 5% confidence interval. Solid lines illustrate real procruste distances values. Significant alignments after FDR corrections are depicted in lighter color (green in the online version). [Color figure can be viewed in the online issue, which is available at http://wileyonlinelibrary.com.]

References

    1. Amoore JE, Johnston JW Jr, Rubin M (1964): The stereochemical theory of odor. Sci Am 210:42–9. - PubMed
    1. Anderson AK, Christoff K, Stappen I, Panitz D, Ghahremani DG, Glover G, Gabrieli JDE, Sobel N (2003): Dissociated neural representations of intensity and valence in human olfaction. Nat Neurosci 6:196–202. - PubMed
    1. Arctander S (1994): Perfume and flavor materials of natural origin (Allured Publishing, Carol Stream (Illinois), 1994).
    1. Ashby FG, Lee WW (1991): Predicting similarity and categorization from identification. J Exp Psychol Gen 120:150. - PubMed
    1. Benjamini Y, Hochberg Y (1995): Controlling the false discovery rate: A practical and powerful approach to multiple testing. J Roy Stat Soc Ser B (Methodological) 57:289–300.

LinkOut - more resources