. 2016 Mar 18;11(3):e0151882.
doi: 10.1371/journal.pone.0151882. eCollection 2016.

Anti-Inflammatory Effects of Acupuncture Stimulation via the Vagus Nerve

Affiliations

Anti-Inflammatory Effects of Acupuncture Stimulation via the Vagus Nerve

Hee-Don Lim et al. PLoS One. .

Abstract

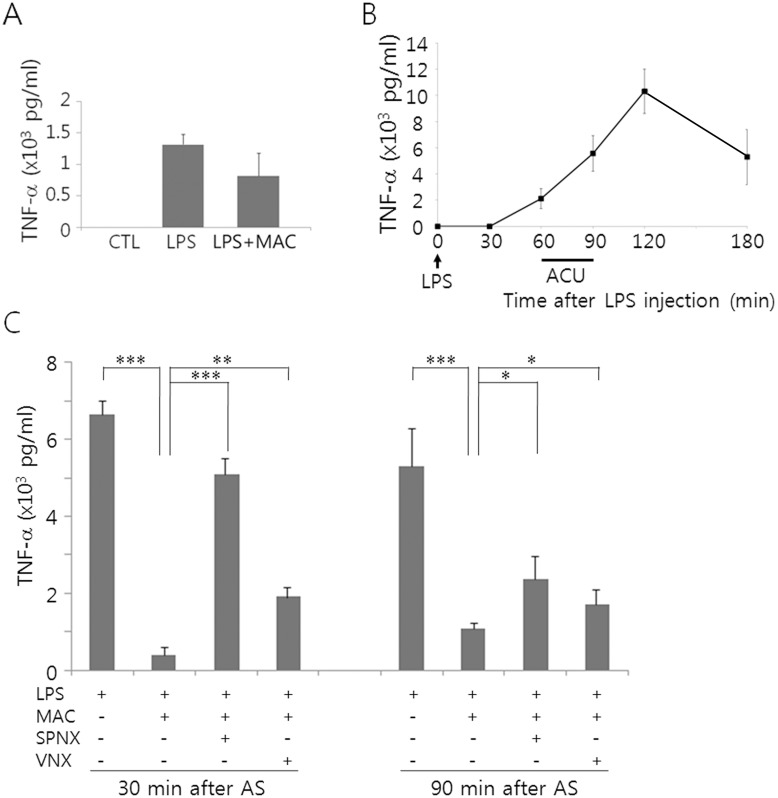
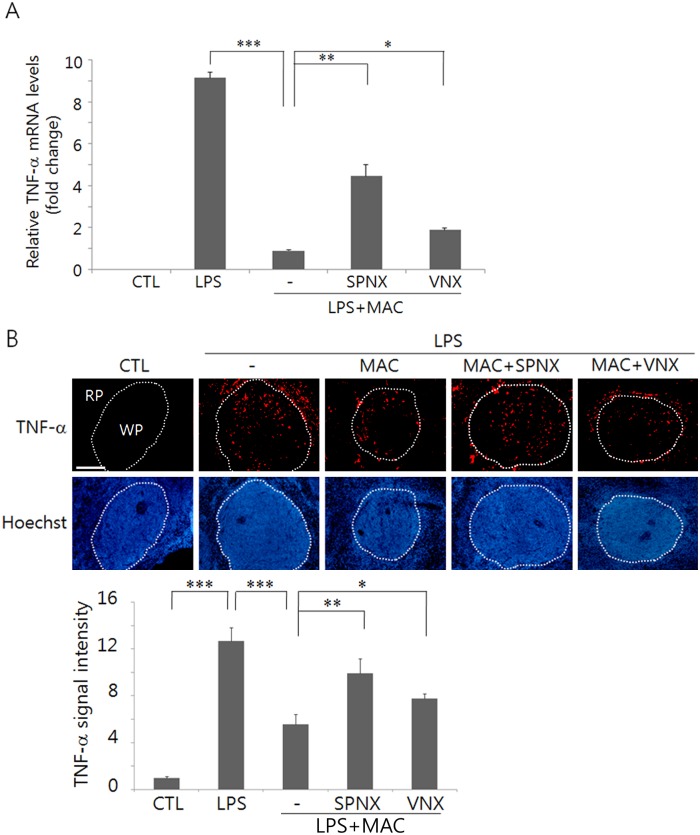
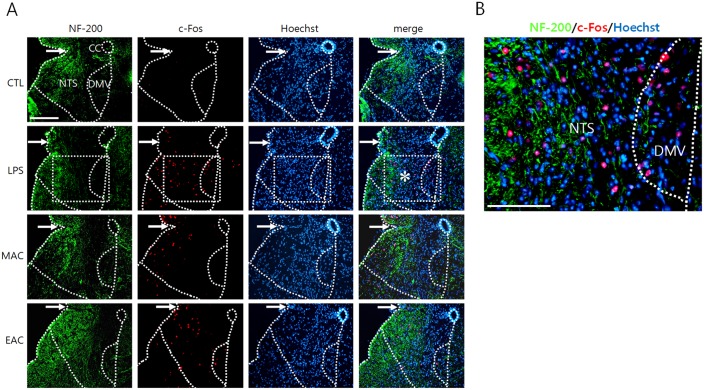
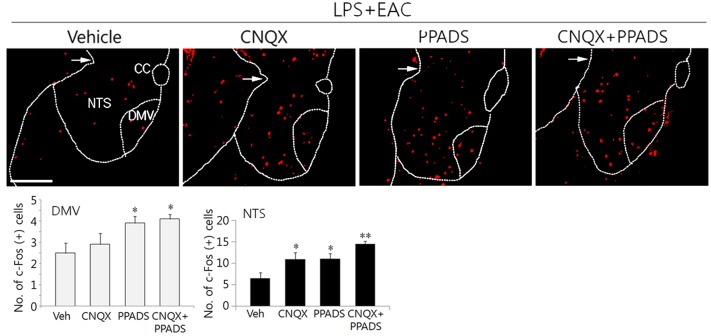
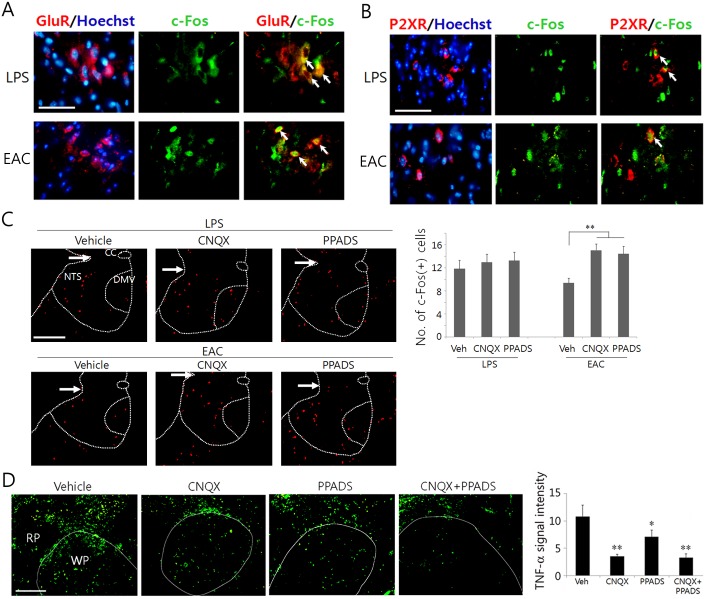
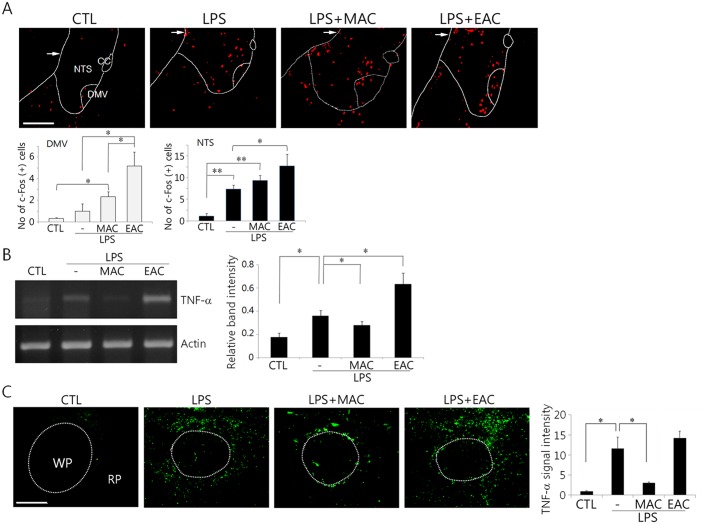
Although acupuncture therapy is widely used in traditional Asian medicine for the treatment of diverse internal organ disorders, its underlying biological mechanisms are largely unknown. Here, we investigated the functional involvement of acupuncture stimulation (AS) in the regulation of inflammatory responses. TNF-α production in mouse serum, which was induced by lipopolysaccharide (LPS) administration, was decreased by manual acupuncture (MAC) at the zusanli acupoint (stomach36, ST36). In the spleen, TNF-α mRNA and protein levels were also downregulated by MAC and were recovered by using a splenic neurectomy and a vagotomy. c-Fos, which was induced in the nucleus tractus solitarius (NTS) and dorsal motor nucleus of the vagus nerve (DMV) by LPS and electroacupuncture (EAC), was further increased by focal administration of the AMPA receptor blocker CNQX and the purinergic receptor antagonist PPADS. TNF-α levels in the spleen were decreased by CNQX and PPADS treatments, implying the involvement of inhibitory neuronal activity in the DVC. In unanesthetized animals, both MAC and EAC generated c-Fos induction in the DVC neurons. However, MAC, but not EAC, was effective in decreasing splenic TNF-α production. These results suggest that the therapeutic effects of acupuncture may be mediated through vagal modulation of inflammatory responses in internal organs.


Conflict of interest statement

Competing Interests: The authors have declared that no competing interests exist.

Figures

Fig 1
Fig 1. Profile of TNF-α production in the serum following AS in mice.
(A) Comparison of TNF-α levels among the non-treated control (CTL), LPS (60 μg/kg), and the LPS plus MAC. MAC stimulation was given 60 min after LPS administration for 30 min, and TNF-α levels in the serum were compared 30 min after the acupuncture. (B) Time-dependent changes of TNF-α in the mice injected with LPS (15 mg/kg). (C) Comparison of TNF-α levels among animal groups with different treatments as indicated in the Figure. Data are means ± SEM [number of animals in each group = 3 in (A) and 4 in (B and C)]. *p<0.01, **p<0.01, ***p<0.001 (one-way ANOVA).
Fig 2
Fig 2. Regulation of TNF-α production by using MAC and a splenic neurectomy (SPNX) and a vagotomy (VNX).
(A) A real-time PCR analysis for TNF-α mRNA expression in the spleen. Graph shows the fold changes of TNF-α mRNA levels in each group relative to internal loading control GAPDH mRNA. (B) Changes in the TNF-α protein signals due to MAC, SPNX, and VNX. The upper pictures are the representative images, and the lower graph shows quantitation of the protein signals in the field. (WP: white pulp, RP: red pulp). Spleen tissues were prepared from animals that had been sacrificed 90 min after AS and were used for real-time PCR and immunofluorescence analyses. *p<0.05, **p<0.01, ***p<0.001 (one-way ANOVA in A and B; n = 4 independent experiments). CTL shows the non-treated controls. The scale bar in (B) is 100 μm.
Fig 3
Fig 3. c-Fos induction in the DVC by AS and LPS administration.
Following LPS injection (180 min later) or AS (90 min later), transverse sections through the caudal portion of the brainstem were used for immunofluorescence staining for NF-200 (green) and c-Fos (red) with Hoechst nuclear counterstaining (blue). An enlarged view (B) of the rectangular area in (asterisk in A) clearly reveals c-fos signals. Arrows in (A) denote the approximate NTS boundary between two hemispheres. cc: central canal. The scale bars in (A) and (B) are 100 μm.
Fig 4
Fig 4. Regulation of c-Fos induction in the DVC by CNQX and PPADS.
Following MAC and EAC in combination with focal administration of CNQX and/or PPADS into the DVC area, transverse sections through the caudal portion of the brainstem were subjected to immunofluoresence staining analyses for c-Fos production. Upper images are the representatives showing c-Fos signals in the brain sections and lower graphs show the quantitation of the protein signals in the field. Mean ± SEM (n = 4 independent experiment). *p<0.05 and **p<0.01 vs. vehicle control (one-way ANOVA). The scale bar is 100 μm.
Fig 5
Fig 5. Identification of cells positive to glutaminergic and purinergic receptors and blockade effects of receptors on c-Fos and TNF-α production.
Following LPS (180 min later) or EAC (90 min later), transverse sections through the caudal portion of the brainstem were used for immunofluorescence staining for GluR2/3 and c-Fos (A), P2X2 receptor (red) and c-Fos (green), and c-Fos. In (D), animals were treated with LPS and EAC, and drugs were also injected as indicated in the figure. Arrows in (A) and (B) denote the cells coexpressing GluR2/3 and c-Fos and P2X2 and c-Fos respectively. Arrows in (C) denote the approximate NTS boundary between two hemispheres. Quantifications of the protein signals are shown in (C) and (D). Mean ± SEM (n = 4 independent experiment). *p<0.05 and **p<0.01, *** vs. vehicle control (one-way ANOVA). The scale bars in (A-D) are 100 μm.
Fig 6
Fig 6. In vivo inductions of c-Fos and TNF-α in animals given LPS and AS without anesthesia.
Sixty minutes after LPS injection, MAC or EAC was given at ST36 for 30 min. Animals were sacrificed 90 min after AS for analyses of the changes in both c-Fos protein signals in the transverse sections through the caudal portion of the brainstem (A) and the TNF-α mRNA and protein in the spleen (B and C, respectively). Quantitations of both the band intensity of splenic TNF-α mRNA relative to the actin control in (B) and the c-Fos and the TNF-α signals in (A) and (C) are shown in bar graphs (mean ± SEM, n = 4 independent experiments). *p<0.05 and **p<0.01 (one-way ANOVA). Arrows in (A) and (B) denote the approximate NTS boundary between two hemispheres. cc: central canal, WP: white pulp, RP: red pulp. CTL: non-treated control. The scale bars in (A) and (C) are 100 μm.

References

    1. Leake R, Broderick JE. Treatment of efficacy of acupuncture: a review of the research literature. Integrative Med 1999;1: 107–115,.
    1. Jänig W. The integrative action of the autonomic nervous system, pp 362–374.: Cambridge University Press; Cambridge, England, 2006.
    1. Kavoussi B, Ross BE. The neuroimmune basis of anti-inflammatory acupuncture. Integr Cancer Ther 2007; 6:251–257. - PubMed
    1. Lux G, Hagel J, Bäcker P, Bäcker G, Vogl R, Ruppin H, et al. Acupuncture inhibits vagal gastric acid secretion stimulated by sham feeding in healthy subjects. Gut 1994; 35:1026–1029. - PMC - PubMed
    1. Nishijo K, Mori H, Yosikawa K, Yazawa K. Decreased heart rate by acupuncture stimulation in humans via facilitation of cardiac vagal activity and suppression of cardiac sympathetic nerve. Neurosci Lett 1997; 227:165–168. - PubMed

Publication types

Substances