. 2016 May;25(10):2176-94.
doi: 10.1111/mec.13605. Epub 2016 Apr 5.

Adaptive divergence despite strong genetic drift: genomic analysis of the evolutionary mechanisms causing genetic differentiation in the island fox (Urocyon littoralis)

Affiliations

Adaptive divergence despite strong genetic drift: genomic analysis of the evolutionary mechanisms causing genetic differentiation in the island fox (Urocyon littoralis)

W Chris Funk et al. Mol Ecol. 2016 May.

Abstract

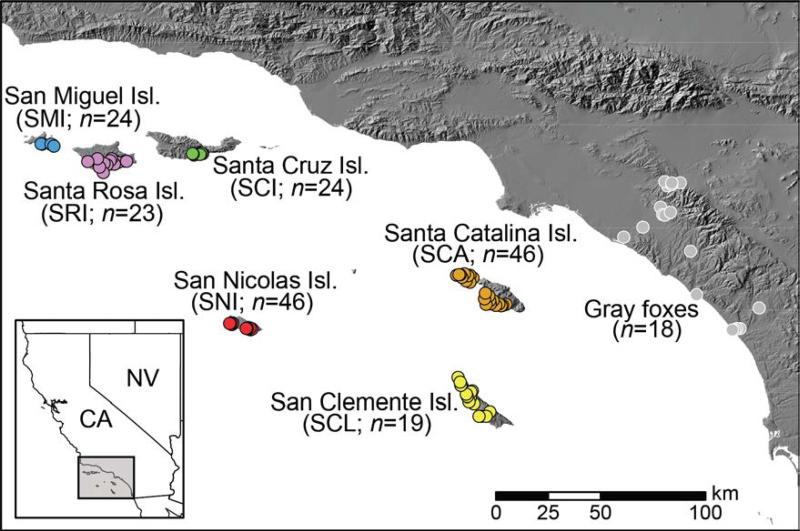
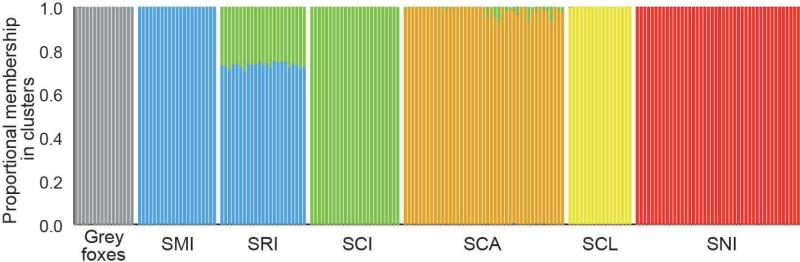
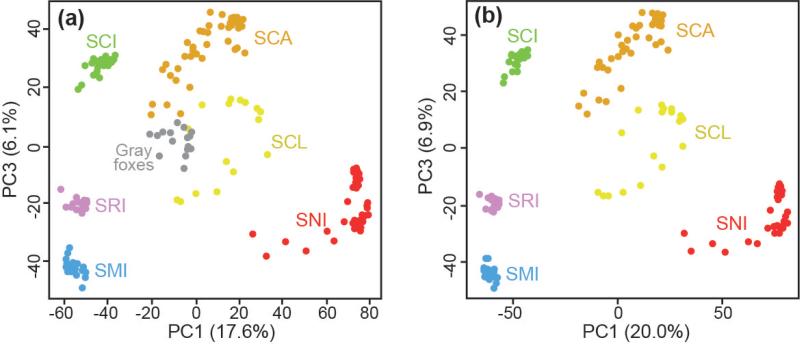
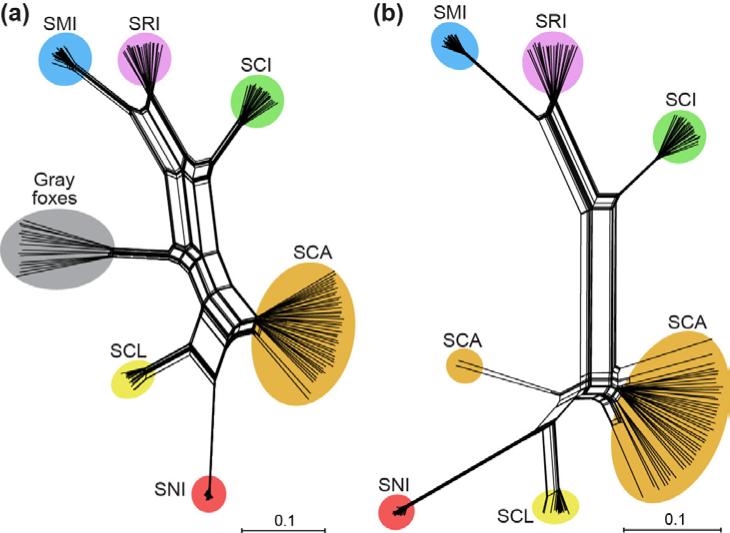
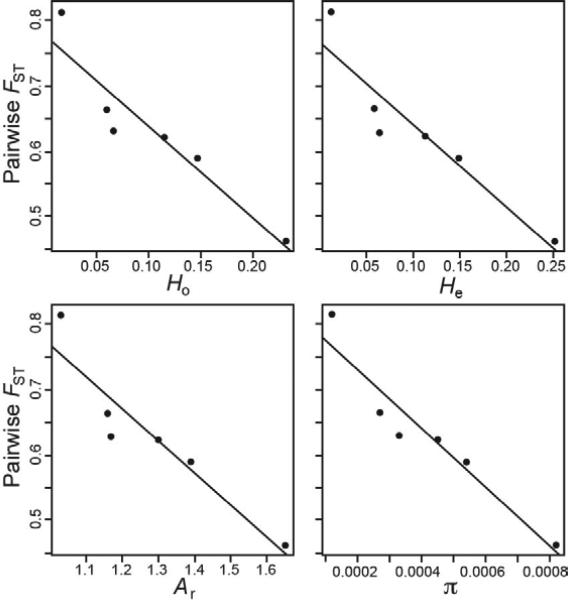
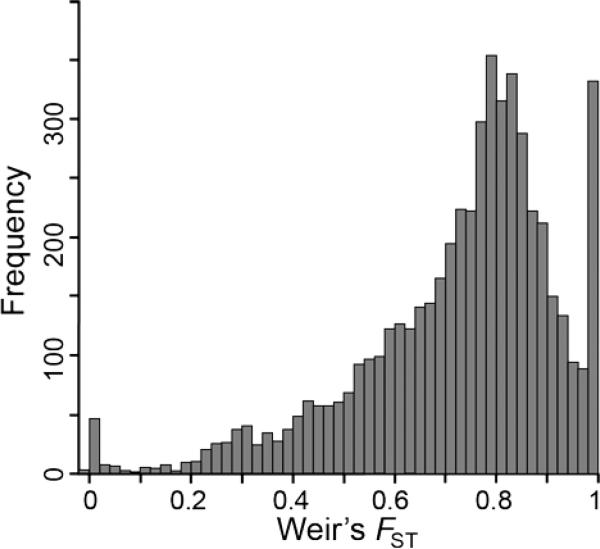
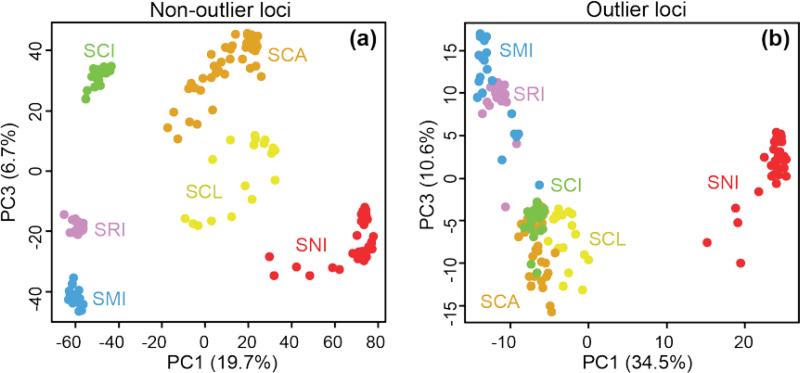
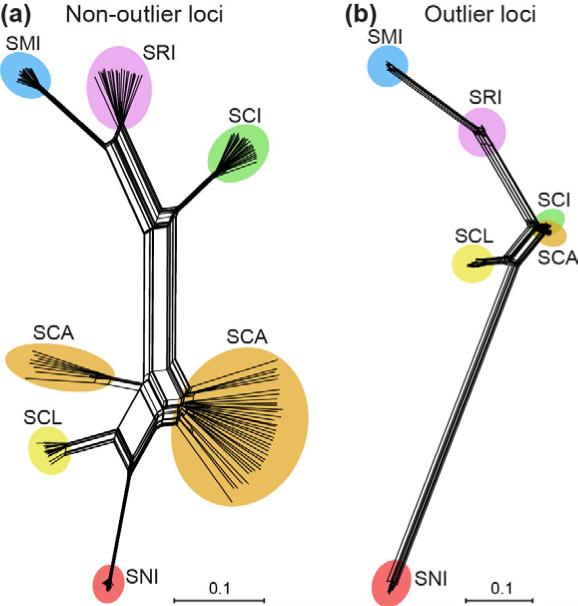
The evolutionary mechanisms generating the tremendous biodiversity of islands have long fascinated evolutionary biologists. Genetic drift and divergent selection are predicted to be strong on islands and both could drive population divergence and speciation. Alternatively, strong genetic drift may preclude adaptation. We conducted a genomic analysis to test the roles of genetic drift and divergent selection in causing genetic differentiation among populations of the island fox (Urocyon littoralis). This species consists of six subspecies, each of which occupies a different California Channel Island. Analysis of 5293 SNP loci generated using Restriction-site Associated DNA (RAD) sequencing found support for genetic drift as the dominant evolutionary mechanism driving population divergence among island fox populations. In particular, populations had exceptionally low genetic variation, small Ne (range = 2.1-89.7; median = 19.4), and significant genetic signatures of bottlenecks. Moreover, islands with the lowest genetic variation (and, by inference, the strongest historical genetic drift) were most genetically differentiated from mainland grey foxes, and vice versa, indicating genetic drift drives genome-wide divergence. Nonetheless, outlier tests identified 3.6-6.6% of loci as high FST outliers, suggesting that despite strong genetic drift, divergent selection contributes to population divergence. Patterns of similarity among populations based on high FST outliers mirrored patterns based on morphology, providing additional evidence that outliers reflect adaptive divergence. Extremely low genetic variation and small Ne in some island fox populations, particularly on San Nicolas Island, suggest that they may be vulnerable to fixation of deleterious alleles, decreased fitness and reduced adaptive potential.

Keywords: conservation genomics; divergent selection; effective population size; genetic drift; population divergence.


Figures

Fig. 1
Fig. 1
Map of island fox and gray fox individuals included in genomic analyses. Abbreviations and sample sizes are shown in parentheses. Inset shows location of study area in southern California, USA.
Fig. 2
Fig. 2
Results from Bayesian individual clustering with Structure for K = 7. Each color corresponds to a distinct genetic cluster and each bar corresponds to the proportion of an individual's genotype assigned to each cluster. Note that although K = 7 was the best-supported number of K, no individuals had any measurable portion (to the thousandths place) of their genome assigned to the seventh cluster, meaning K = 6 effectively had the highest support.
Fig. 3
Fig. 3
Principal component analysis (PCA) to characterize genetic differentiation among island fox populations using SNP loci with (a) or without (b) the gray fox outgroup. As PC2 primarily reflected the amount of missing data, we used PC1 and PC3 to visualize genetic divergence among individuals. Colors and abbreviations correspond to different islands as shown in Fig. 1.
Fig. 4
Fig. 4
Neighbor-net tree to characterize genetic differentiation among island fox populations using SNP loci with (a) or without (b) the gray fox outgroup. Colors and abbreviations correspond to different islands as shown in Fig. 1.
Fig. 5
Fig. 5
Scatterplots of pairwise FST values between gray foxes and each island fox population vs. different measures of within population genetic variation (Ho, observed heterozygosity; He, expected heterozygosity; Ar, allelic richness; π, nucleotide diversity). All four relationships were statistically significant (P < 0.05; indicated by solid black regression lines).
Fig. 6
Fig. 6
Histogram of Weir's FST values among all island fox populations at 5293 SNP loci.
Fig. 7
Fig. 7
Principle component analysis (PCA) to characterize genetic differentiation among island fox populations using high FST outlier SNPs or non-outliers. (a) PCA based on 5028 presumably neutral SNPs not identified as high FST outliers or (b) 265 presumably adaptive SNPs identified as high FST outliers. Here, outlier loci were identified as the highest 5% of FST values. As PC2 primarily reflected the amount of missing data, we used PC1 and PC3 to visualize genetic divergence among individuals. Colors and abbreviations correspond to different islands as shown in Fig. 1. See Figs. S3 and S4 for PCA using four different methods for identifying outlier loci (highest 5% of FST values, FDist2, FDist2 with the false discovery rate correction, or BayesFST) with (Fig. S3) or without (Fig. S4) gray foxes.
Fig. 8
Fig. 8
Neighbor-net trees to characterize genetic differentiation among island fox populations using high FST outlier SNPs or non-outliers. (a) Neighbor-net trees based on 5028 presumably neutral SNPs not identified as high FST outliers or (b) 265 presumably adaptive SNPs identified as high FST outliers. Here, outlier loci were identified as the highest 5% of FST values. Colors and abbreviations correspond to different islands as shown in Fig. 1. See Figs. S5 and S6 for Neighbor-net trees using four different methods for identifying outlier loci (highest 5% of FST values, FDist2, FDist2 with the false discovery rate correction, or BayesFST) with (Fig. S5) or without (Fig. S6) gray foxes.

References

    1. Aguilar A, Roemer G, Debenham S, et al. High MHC diversity maintained by balancing selection in an otherwise genetically monomorphic mammal. Proceedings of the National Academy of Sciences of the United States of America. 2004;101:3490–3494. - PMC - PubMed
    1. Baird NA, Etter PD, Atwood TS, et al. Rapid SNP discovery and genetic mapping using sequenced RAD markers. PLoS ONE. 2008;3:e3376. - PMC - PubMed
    1. Balkenhol N, Waits LP, Dezzani RJ. Statistical approaches in landscape genetics: an evaluation of methods for linking landscape and genetic data. Ecography. 2009;32:818–830.
    1. Beaumont MA, Balding DJ. Identifying adaptive genetic divergence among populations from genome scans. Molecular Ecology. 2004;13:969–980. - PubMed
    1. Beaumont MA, Nichols RA. Evaluating loci for use in the genetic analysis of population structure. Proceedings of the Royal Society B-Biological Sciences. 1996;263:1619–1626.

Publication types