. 2016 Mar 29;7(13):15369-81.
doi: 10.18632/oncotarget.8085.

Downregulation of the stress-induced ligand ULBP1 following SV40 infection confers viral evasion from NK cell cytotoxicity

Affiliations

Downregulation of the stress-induced ligand ULBP1 following SV40 infection confers viral evasion from NK cell cytotoxicity

Yoav Bauman et al. Oncotarget. .

Abstract

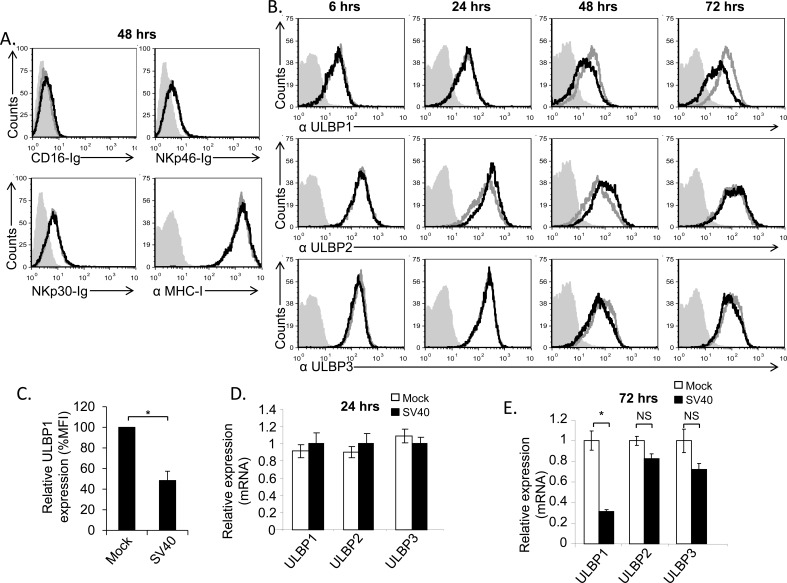
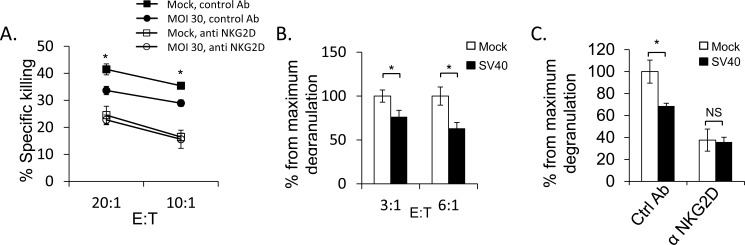
Polyomaviruses are a diverse family of viruses which are prevalent in the human population. However, the interactions of these viruses with the immune system are not well characterized. We have previously shown that two human polyomaviruses, JC and BK, use an identical microRNA to evade immune attack by Natural Killer (NK) cells. We showed that this viral microRNA suppresses ULBP3 expression, a stress induced ligand for the killer receptor NKG2D. Here we show that Simian Virus 40 (SV40) also evades NK cell attack through the down regulation of another stress-induced ligand of NKG2D, ULBP1. These findings indicate that NK cells play an essential role in fighting polyomavirus infections and further emphasize the importance of various members of the ULBP family in controlling polyomavirus infection.

Keywords: Immune response; Immunity; Immunology and Microbiology Section; NK cells; NKG2D; SV40; ULBP1; immune-evasion.


Conflict of interest statement

CONFLICTS OF INTEREST

The authors have no conflict of interest.

Figures

Figure 1
Figure 1. MCF7 cells support productive SV40 infection
A. FACS staining for SV40 L-TAg (upper dot plots) and VP1 (bottom dot plots) in SV40-infected MCF7 cells (MOI 10, right two dot plots) and mock-infected cells (left two dot plots). Percentage of positive cells is indicated. B. Cytopathic effect as seen by light microscopy in SV40 infected cells 4-5 days post infection (MOI 10). C. Quantification of SV40 infectious units (IU), produced 3, 4, and 6 days post infection in MCF7 cells. Shown are mean values ± SD. No infectious units were observed in mock-infected cells. Figure shows one representative experiment out of 3 performed.
Figure 2
Figure 2. The stress-induced ligand ULBP1 is reduced following SV40 infection
A.-B. FACS analysis for the expression of major NK ligands on SV40 infected MCF7 cells (black open histogram, MOI 10) compared to mock infected cells (grey open histogram). Ligands were detected by fusion proteins (A), 48 hours post infection, and by mAbs (B) at the indicated time points. The fusion proteins/mAbs used are indicated below the histograms. The filled gray histogram represents the staining of the mock cells by secondary antibodies only. The background staining of all other cells was similar to the background staining of mock cells and is not shown in the figure. Figure combines 3 independent experiments. C. Quantification of ULBP1 downregulation in SV40 infected cells (72 hours post infection) relative to mock cells, determined by relative MFI (Mean Florescence Intensity) reduction. Shown are mean values ± SD. Statistically significant differences are indicated (*P < 0.002, by one-tailed t test). Error bars (SD) are derived from three independent experiments. D.-E. Expression level of ULBPs mRNA, determined by qPCR, 24 hours (hrs) (D) and 72hrs (E) post infection, in SV40 infected cells compared to mock infected cells. Statistically significant differences are indicated (* P < 0.02 by one-tailed t test). Error bars (SD) are derived from triplicates. Results are representative of three independent experiments. NS, not significant.
Figure 3
Figure 3. ULBP1 downregulation following infection is correlates with MOI and also observed in CV-1 cells
A., D. FACS staining for SV40 L-TAg in infected MCF7 cells at different MOIs (A, as indicated above the dot plots) or in CV-1 SV40 infected cells (MOI 10, 48h post infection, D). Percentages of positive cells are indicated. B., E. Western blot analysis for the expression of ULBP1 (upper lanes) in SV40 infected MCF7 cells at different MOIs (B) and in SV40 infected CV-1 cells (E) compared to mock cells. GAPDH was used as control (lower lanes in B and E). Backgrounds of WB images were adjusted for better visualization. Figure shows one representative experiment out of three performed. C., F. Relative quantification of ULBP1 expression in infected MCF7 (C) and infected CV-1 cells (F). Levels are shown relative to ULBP1 expression level in mock cells, which was set to 1. GAPDH served as normalizer in all samples. G. FACS analysis for the expression of NKG2D ligands or NKp30 ligands by staining of SV40 infected and uninfected CV-1 cells with NKG2D-Ig or NKp30-Ig (indicated below the histograms) (black open histogram, MOI 10), compared to mock infected cells (grey open histogram) 48h post infection.
Figure 4
Figure 4. Down regulation of ULBP1 is not mediated by the viral capsid components
A. MCF7 cells were treated with VLPs (1.2 μg) or infected with SV40 (MOI 10), extensively washed and then incubated at 37C for 6 hours. Lysates were prepared, run on SDS-PAGE gels and western blot was performed with anti-VP1 mAb. GAPDH was used as a loading control. Backgrounds of WB images were adjusted for better visualization. B. FACS analysis of ULBP1 expression in VLP treated MCF7 cells (black open histogram) compared to mock-treated cells (open gray histogram). The filled gray histogram represents the staining of the mock-treated cells with the secondary antibodies only. The background staining of the VLP-treated cells was similar to the mock cells and is not shown in the figure. Figure shows one representative experiment out of three performed. C. FACS staining for SV40 L-TAg in SV/mKate infected MCF7 cells (right dot blot) and in mock cells (left dot blot). D. FACS analysis of ULBP1 expression in SV/mKate infected MCF7 cells (black open histogram) compared to mock cells (open gray histogram). The filled gray histogram represents the staining of the mock cells with secondary antibodies only. The background staining of the SV/mKate-MCF7 infected cells was similar to the mock cells and is not shown in the figure.
Figure 5
Figure 5. SV40 miRNAs and agnoprotein do not mediate the ULBP1 downregulation
A., C. qRT-PCR analysis for the expression of SV40 microRNAs, performed at 72 hours post infection. qRT-PCR was performed in SV40-infected and in SV40 microRNA mutant (SM)-infected MCF7 cells as well as in mock infected cells (A) and in cells transduced (designated MCF7 OE) with the viral microRNAs (C). Statistically significant differences are indicated (*P < 0.005 by one-tailed t test). Error bars (SD) are derived from triplicates. Results are representative of three independent experiments. B. FACS analysis for the expression of various ULBPs (as indicated below the histograms) at 72h following MCF7 cells infected with SV40 (black open histogram) and with SM (red open histogram) as compared to mock-infected cells (gray open histogram). The filled gray histogram represents the background staining of the mock cells by secondary mAb only. The background stainings of all other cells shown in the figure were similar to the background staining of mock cells and are not shown in the figure. Figure shows one representative experiment out of three performed. D. FACS analysis for the expression of various ULBPs (as indicated below the histograms), at 72h post transduction with miR-S1-5p (black open histogram) and with miR-S1-3p (red open histogram) as compared to parental cells (gray open histogram). The filled gray histogram represents the staining of the mock cells by secondary antibodies only. The background stainings of all other cells shown in the figure were similar to the background staining of mock cells and are not shown in the figure. Figure shows one representative experiment out of three performed. E. Western blot analysis for agnoprotein expression in SV40 (WT) and SV40 mutated in the agnoprotein start codon (Δagno), in infected MCF7 cells, or in mock infected cells (Mock). Background of WB images was adjusted for better visualization. F. FACS analysis for the expression of ULBP1, 72h post infection with SV40 (black open histogram) or with Δagno mutant (red open histogram) MCF7 cells compared to mock infected cells (gray open histogram). The filled gray histogram represents the mock staining of the secondary antibodies only. The backgrounds staining of all other cells shown in the figure were similar to the background staining of mock cells and are not shown in the figure. Figure shows one representative experiment out of three performed.
Figure 6
Figure 6. Induction of ULBP1 expression following large T-antigen expression
A., B. Western blot analysis for the expression of VP1, large T-Ag (A) and VP2 (B) in cells transduced with the relevant plasmid as indicated in the left of the figure, compared to cells transduced with empty vector. The backgrounds of WB images were adjusted for better visualization. C. FACS analysis for the expression of ULBPs (as indicated below the histograms) in MCF7 cells transduced with VP1 (red open histogram) or VP2 (blue open histogram) and in cells transduced with a control vector (black open histogram). The filled gray histogram represents the staining of the mock-infected cells by secondary mAb only. The background stainings of all other cells shown in the figure were similar to the background staining of mock cells and are not shown in the figure. Figure shows one representative experiment out of three performed. D. FACS analysis for the expression of ULBPs (as indicated below the figures) in MCF7 cells transduced with SV40 L-TAg (black open histogram), compared to cells transduced with a control vector (gray open histogram). The filled gray histogram represents the staining of the control vector cells by secondary antibodies only. The background staining of SV40 L-TAg was similar to the background staining of control vector cells and is not shown in the figure. Figure shows one representative experiment out of three performed.
Figure 7
Figure 7. SV40 infected MCF7 cells are less susceptible to NKG2D mediated killing
A. Bulk NK cells were pre-incubated with anti-NKG2D mAb or with isotype control mAb (control Ab). Infected or mock-infected MCF7 cells were then added and incubated for 5 hours at the indicated effector:target (E:T) ratios. Shown are mean values ± SD. Statistically significant differences are indicated (mock versus infected *P < 0.02, by one-tailed t test). Error bars (SD) are derived from triplicates. Figure show one representative experiment out of three performed. B. SV40 infected or mock infected MCF7 cells were incubated with bulk NK cells for 2 hours at the indicated E:T ratios and NK degranulation was determined by FACS staining for CD107a (LAMP-1) expression. The degranulation of mock infected cells was setup to be 100%. Shown are mean values ± SD. Statistically significant differences are indicated (*P < 0.005, by one-tailed t test). Error bars (SD) are derived from triplicates. Figure show one representative experiment out of three performed. C. Bulk NK cells were pre-incubated with anti-NKG2D blocking mAb or with isotype-matched control (Ctrl) mAb and then co-cultured with SV40 infected cells or mock infected cells in an E:T ratio of 3:1 for 2 hours. The degranulation of mock infected cells was setup to be 100%. Shown are mean values ± SD. Statistically significant differences are indicated (*P < 0.005, by one-tailed t test). Error bars (SD) are derived from triplicates. Figure show one representative experiment out of three performed.

References

    1. Arnon TI, Markel G, Mandelboim O. Tumor and viral recognition by natural killer cells receptors. Seminars in cancer biology. 2006;16:348–358. - PubMed
    1. Cheent K, Khakoo SI. Natural killer cells: integrating diversity with function. Immunology. 2009;126:449–457. - PMC - PubMed
    1. Pegram HJ, Andrews DM, Smyth MJ, Darcy PK, Kershaw MH. Activating and inhibitory receptors of natural killer cells. Immunology and cell biology. 2011;89:216–224. - PubMed
    1. Bottino C, Castriconi R, Moretta L, Moretta A. Cellular ligands of activating NK receptors. Trends in immunology. 2005;26:221–226. - PubMed
    1. Mandelboim O, Lieberman N, Lev M, Paul L, Arnon TI, Bushkin Y, Davis DM, Strominger JL, Yewdell JW, Porgador A. Recognition of haemagglutinins on virus-infected cells by NKp46 activates lysis by human NK cells. Nature. 2001;409:1055–1060. - PubMed

MeSH terms

Substances

LinkOut - more resources