. 2016 Mar 15;342(2):125-34.
doi: 10.1016/j.yexcr.2016.03.005. Epub 2016 Mar 15.

Granulocyte colony-stimulating factor (G-CSF) upregulates β1 integrin and increases migration of human trophoblast Swan 71 cells via PI3K and MAPK activation

Affiliations

Granulocyte colony-stimulating factor (G-CSF) upregulates β1 integrin and increases migration of human trophoblast Swan 71 cells via PI3K and MAPK activation

Verónica A Furmento et al. Exp Cell Res. .

Abstract

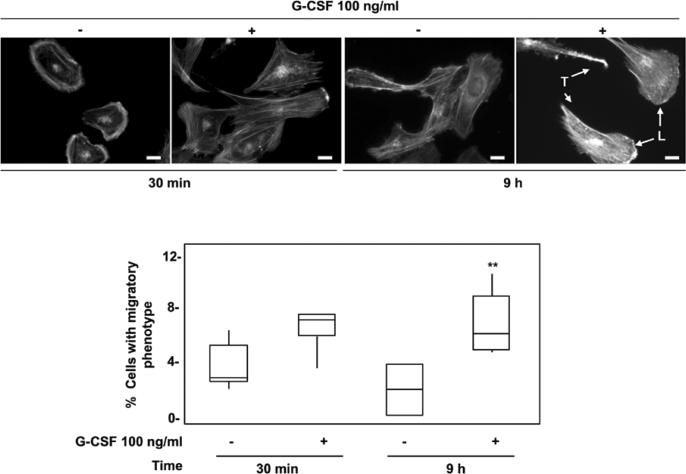
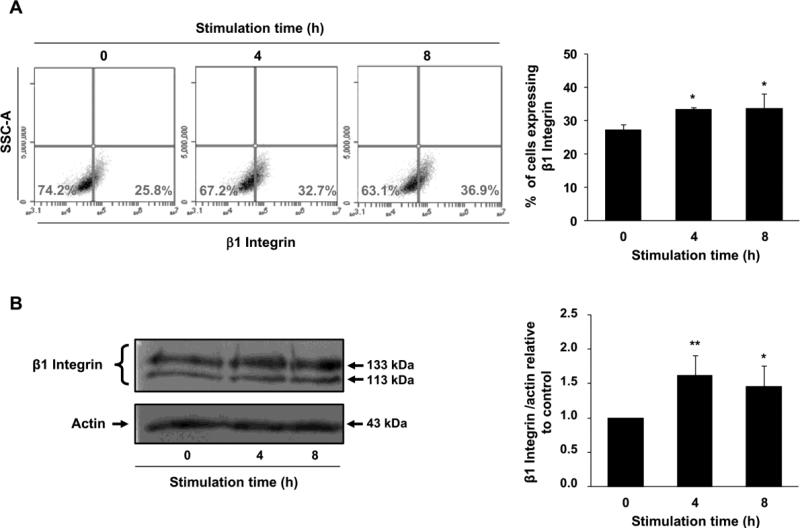
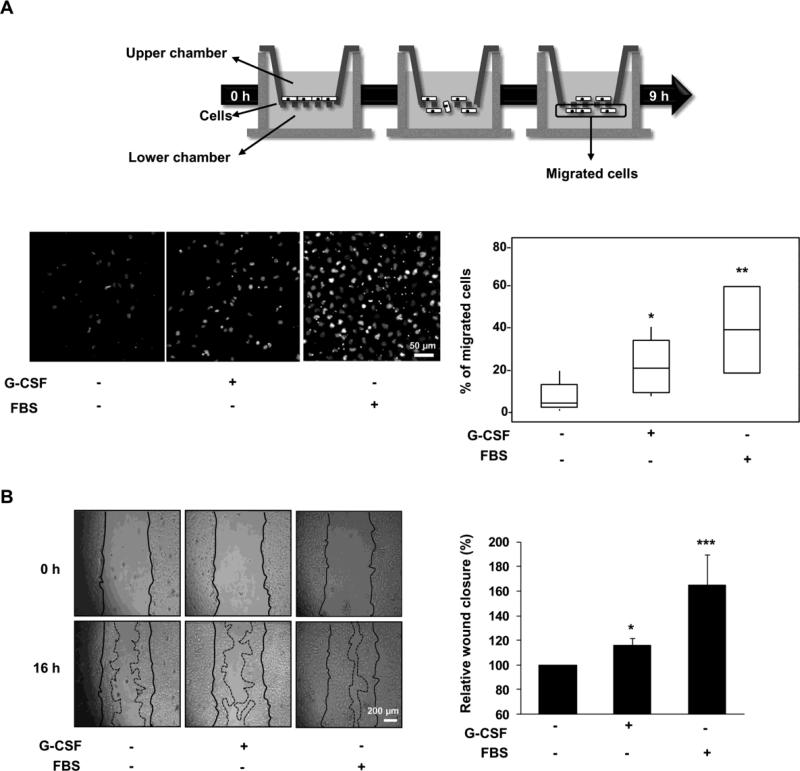
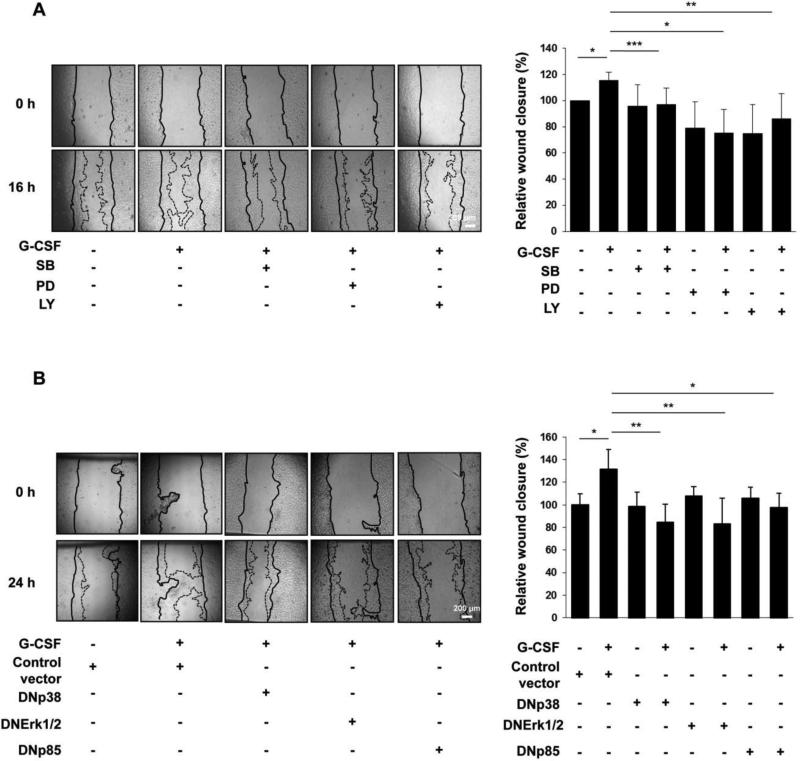
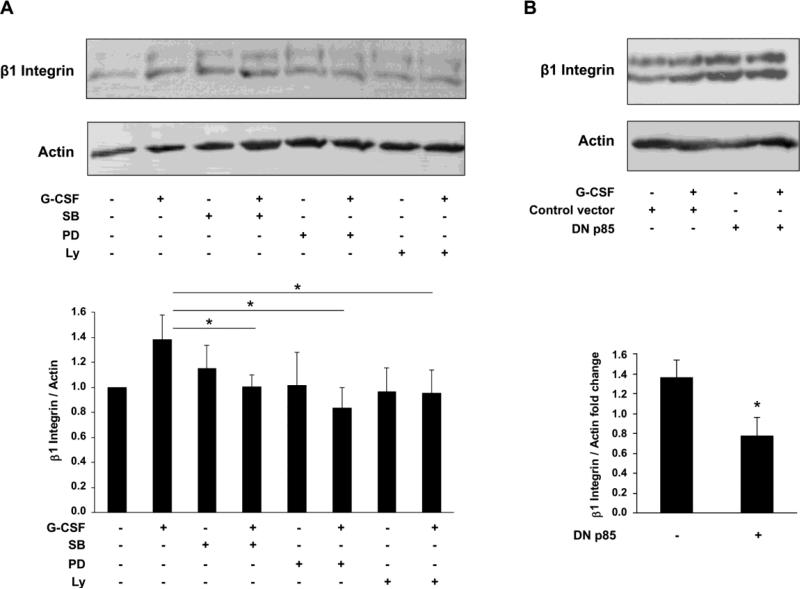
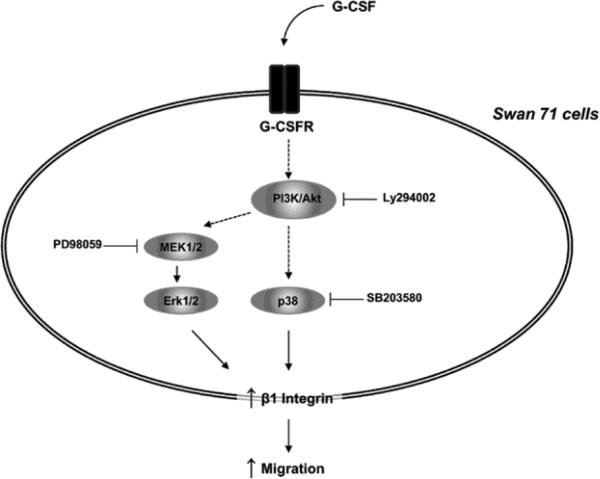
Multiple cytokines and growth factors expressed at the fetal-maternal interface are involved in the regulation of trophoblast functions and placental growth, but the role of G-CSF has not been completely established. Based on our previous study showing that G-CSF increases the activity of matrix metalloproteinase-2 and the release of vascular endothelial growth factor in Swan 71 human trophoblast cells, in this work we explore the possible contribution of G-CSF to cell migration and the G-CSF-triggered signaling pathway. We found that G-CSF induced morphological changes on actin cytoskeleton consistent with a migratory cell phenotype. G-CSF also up-regulated the expression levels of β1 integrin and promoted Swan 71 cell migration. By using selective pharmacological inhibitors and dominant negative mutants we showed that PI3K, Erk 1/2 and p38 pathways are required for promoting Swan 71 cell motility. It was also demonstrated that PI3K behaved as an upstream regulator of Erk 1/2 and p38 MAPK. In addition, the increase of β1 integrin expression was dependent on PI3K activation. In conclusion, our results indicate that G-CSF stimulates β1 integrin expression and Swan 71 cell migration by activating PI3K and MAPK signaling pathways, suggesting that G-CSF should be considered as an additional regulatory factor that contributes to a successful embryo implantation and to the placenta development.

Keywords: G-CSF; MAPK; Migration; PI3K; Swan 71 cells; β1 Integrin.


Figures

Fig. 1
Fig. 1
Effect of G-CSF on actin cytoskeleton organization in Swan 71 cells. Swan 71 cells grown up on coverslips were incubated 30 min or 9 h in the presence or absence of 100 ng/ml of G-CSF. After washing with PBS, cells were fixed with 4% p-formaldehyde and then incubated with rhodamine-phalloidin. Stained cells were examined with a fluorescence microscope. The percentage of cells with migratory phenotype (presence of lamellipodium, L, and tail, T) from four independent experiments are shown in the lower panel represented in a Box and Whiskers graph. Non-parametric Wilcoxon test, **p<0.01. Magnification 400x, scale bar: 20 μm.
Fig. 2
Fig. 2
β1 integrin expression after treatment of Swan 71 cells with G-CSF. Non-confluent monolayers of Swan 71 cells maintained 24 h in serum-free medium were incubated for 4 and 8 h in the absence or presence of 100 ng/ml of G-CSF. (A) After washing with PBS, cells were fixed with 1% paraformaldehyde and β1 integrin expression was analyzed by flow cytometry under the conditions described in Material and methods. Dot plots of one representative experiment are shown. Results are expressed as the media ± SE of three independent experiments (right panel). Statistical analyses were performed by one-way ANOVA followed by Bonferroni post-hoc tests. * p<0.05, significantly different from non-stimulated cells. (B) Cell lysates were subjected to SDS-PAGE under the conditions described in Material and methods. Western blot assays were performed with an anti-β1 integrin or anti-actin antibody. Results from one representative experiment are shown (left panels). Data quantification was performed by densitometric analysis (right panel). Statistical analyses were performed by one-way ANOVA followed by Bonferroni post-hoc tests. * p<0.05, ** p<0.01, (n=5), significantly different from non-stimulated cells.
Fig. 3
Fig. 3
G-CSF-induced migration of Swan 71 cells. (A) Swan 71 cells seeded in the upper chamber were allowed to migrate toward the lower chamber containing 100 ng/ml of G-CSF or 10% FBS. After swabbing non-migrated cells in the upper chamber, the migrated cells (filter lower face) were stained with DAPI and counted by microscopy. Fields from a representative experiment of DAPI-stained cells are shown (left panel). Scale bar: 50 μm. Box and Whiskers graph from results of five independent experiments are shown in the right panel. Non-parametric Wilcoxon test, *p<0.05, **p<0.01. (B) Monolayers of Swan 71 cells maintained 24 h in serum-free medium were scratched and incubated with or without 100 ng/ml of G-CSF or FBS during 16 h. Pictures were taken at 0 and 16 h with a camera coupled to a microscopy. Fields from one representative experiment are shown (left panel). The area of the wound was analyzed using Image J. Results are expressed as the media ± SE of the percentage of wound closure relative to control, n=9 (right panel). Statistical analyses were performed by one-way ANOVA followed by Bonferroni post-hoc tests. *p<0.05, ***p<0.001.
Fig. 4
Fig. 4
Effect of p38, Erk 1/2 and PI3K pharmacological inhibitors and dominant negatives mutants on G-CSF-induced cell migration. (A) Monolayers of Swan 71 were pre-treated for 1 h at 37 °C with or without SB (2 μM), PD (1 μM) or Ly (1 μM). After scratching the monolayers, cells were incubated for 16 h in serum-free medium containing 100 ng/ml of G-CSF. Pictures were taken at 0 and 16 h. Fields from one representative experiment are shown (left panel). The area of the wound was analyzed using Image J. Results are expressed as the media ± SE of the percentage of wound closure relative to control, n=6 (right panel). Statistical analyses were performed by one-way ANOVA followed by Bonferroni post-hoc tests. *p<0.05, **p<0.01, ***p<0.001. (B) Monolayers of Swan 71 were transiently transfected either with DNp38, DNErk 1/2 and DNp85 constructs or the corresponding control vectors. After scratching the monolayers, cells were incubated for 24 h in serum-free medium containing 100 ng/ml of G-CSF. Pictures were taken at 0 and 24 h. Control vector corresponds to results obtained after incubating cells with DNp38 control vector (pcDNA3). Similar results were obtained with DNp85 and DNErk 1/2 control vectors. Fields from one representative experiment are shown (left panel). The area of the wound was analyzed using Image J. Results are expressed as the media ± SE of the percentage of wound closure relative to control, n=6 (right panel). Statistical analyses were performed by one-way ANOVA followed by Bonferroni post-hoc tests. *p<0.05, **p<0.01.
Fig. 5
Fig. 5
Effect of Ly and DNp85 mutant on G-CSF-induced Erk 1/2 and p38 phosphorylation. Monolayers of Swan 71 cells maintained 24 h in serum-free medium were pre-treated for 1 h at 37 °C with or without 1 μM Ly and then exposed for 15 min (A) or 45 min (C) to 100 ng/ml of G-CSF. Alternatively, Swan 71 cells were transfected with the DNp85 construct and then stimulated for 15 min (B) or 45 min (D) with 100 ng/ml of G-CSF. Western blot assays were performed with anti-p-Erk 1/2 and anti-Erk 1/2 (A and B), anti-p-p38 and anti-p38 (C and D). Results from one representative experiment are shown (top panels). Data quantification was performed by densitometric analysis (lower panels). Statistical analyses were performed by one-way ANOVA followed by Bonferroni post-hoc tests (A and C) or Student's t-test (B and D). *** p<0.001, ** p<0.01, *p<0.05, n=3.
Fig. 6
Fig. 6
Effect of p38, Erk 1/2 and PI3K pharmacological inhibitors and DNp85 mutant on G-CSF-induced β1 integrin expression. Monolayers of Swan 71 cells maintained 24 h in serum-free medium were (A) pre-treated for 1 h at 37 °C with or without SB (2 μM), PD (1 μM) or Ly (1 μM) or (B) transfected with DNp85 mutant or the corresponding control vector. Cells were then incubated for 4 h in the presence or absence of 100 ng/ml of G-CSF. Western blot assays were performed with anti-β1 integrin or anti-actin antibodies. Results from one representative experiment are shown (upper panel). Data quantification was performed by densitometric analysis (lower panel). Statistical analyses were performed by one-way ANOVA followed by Tukey's Multiple Comparison Test (A) or Student's t-test (B). * p<0.05, n=3.
Fig. 7
Fig. 7
Schematic representation of the signaling pathways involved in the migration induced by G-CSF in human trophoblast Swan 71 cells. After binding of G-CSF to G-CSF receptor, activation of PI3K/Akt pathway is followed by phosphorylation of p38 and Erk 1/2 MAPKs, leading to an increase of β1integrin expression and cell migration.

References

    1. Demetri GD, Griffin JD. Granulocyte colony-stimulating factor and its receptor. Blood. 1991;78:2791–2808. - PubMed
    1. van de Geijn GJ, Aarts LH, Erkeland SJ, Prasher JM, Touw IP. Granulocyte colony-stimulating factor and its receptor in normal hematopoietic cell development and myeloid disease. Rev. Physiol. Biochem. Pharmacol. 2003;149:53–71. - PubMed
    1. Touw IP, van de Geijn GJ. Granulocyte colony-stimulating factor and its receptor in normal myeloid cell development, leukemia and related blood cell disorders. Front. Biosci. 2007;12:800–815. - PubMed
    1. Liongue C, Wright C, Russell AP, Ward AC. Granulocyte colony-stimulating factor receptor: stimulating granulopoiesis and much more. Int. J. Biochem. Cell. Biol. 2009;41:2372–2375. - PubMed
    1. Bussolino F, Ziche M, Wang JM, Alessi D, Morbidelli L, Cremona O, Bosia A, Marchisio PC, Mantovani A. In vitro and in vivo activation of endothelial cells by colony-stimulating factors. J. Clin. Invest. 1991;87:986–995. - PMC - PubMed

Publication types

MeSH terms

Substances