. 2017 Apr;66(4):633-643.
doi: 10.1136/gutjnl-2015-309595. Epub 2016 Mar 18.

Tumour-associated and non-tumour-associated microbiota in colorectal cancer

Affiliations

Tumour-associated and non-tumour-associated microbiota in colorectal cancer

Burkhardt Flemer et al. Gut. 2017 Apr.

Abstract

Objective: A signature that unifies the colorectal cancer (CRC) microbiota across multiple studies has not been identified. In addition to methodological variance, heterogeneity may be caused by both microbial and host response differences, which was addressed in this study.

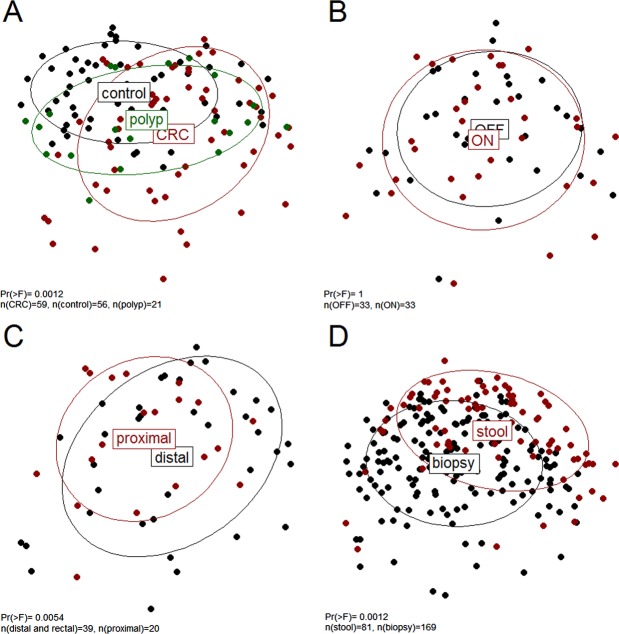
Design: We prospectively studied the colonic microbiota and the expression of specific host response genes using faecal and mucosal samples ('ON' and 'OFF' the tumour, proximal and distal) from 59 patients undergoing surgery for CRC, 21 individuals with polyps and 56 healthy controls. Microbiota composition was determined by 16S rRNA amplicon sequencing; expression of host genes involved in CRC progression and immune response was quantified by real-time quantitative PCR.

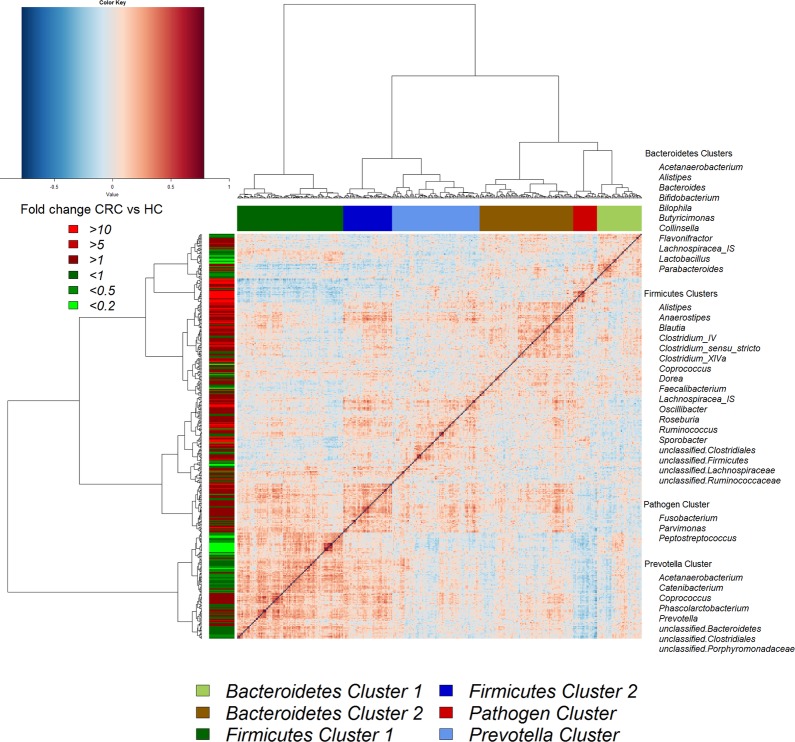
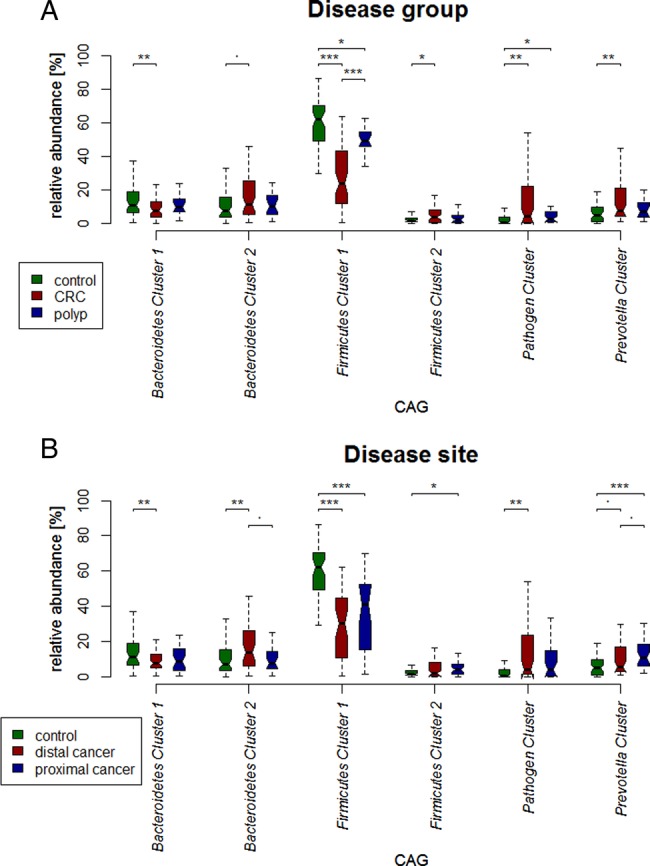
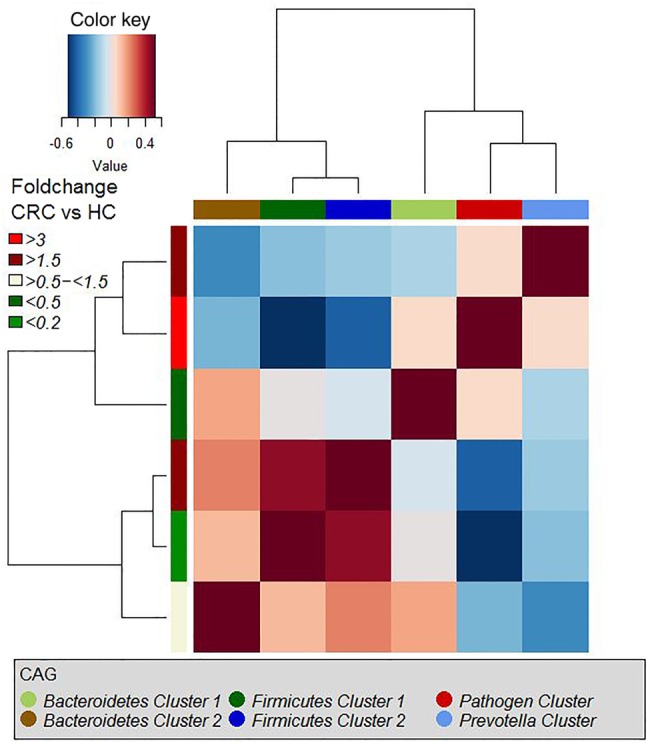
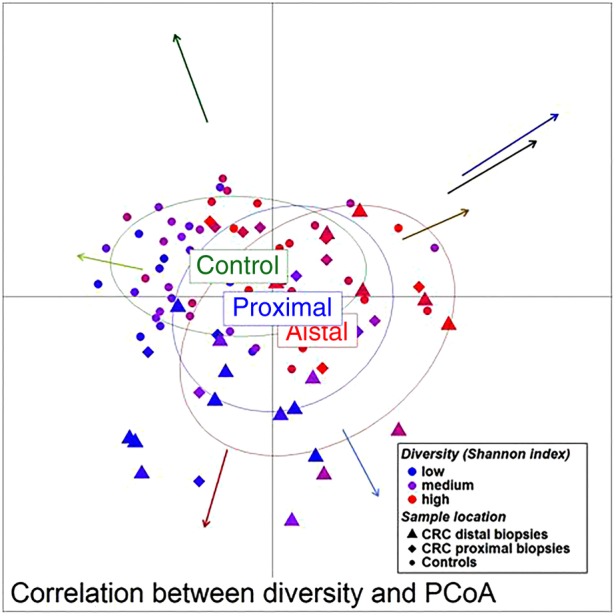
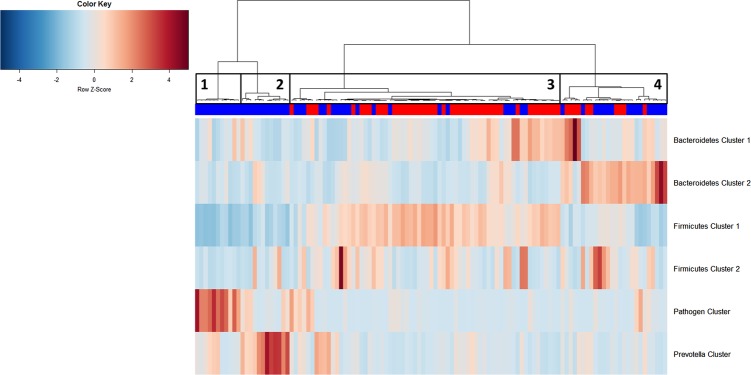
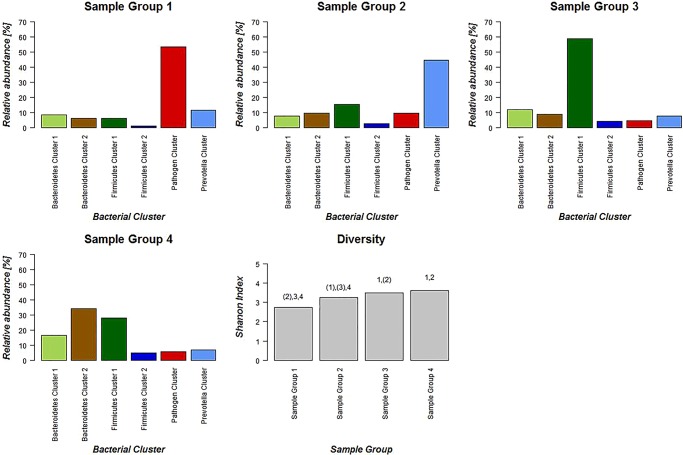
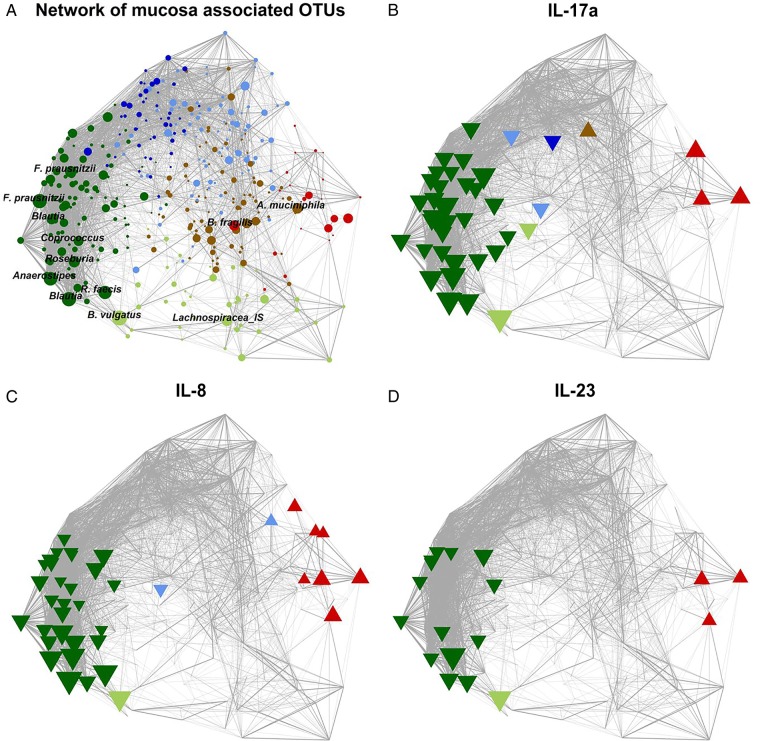
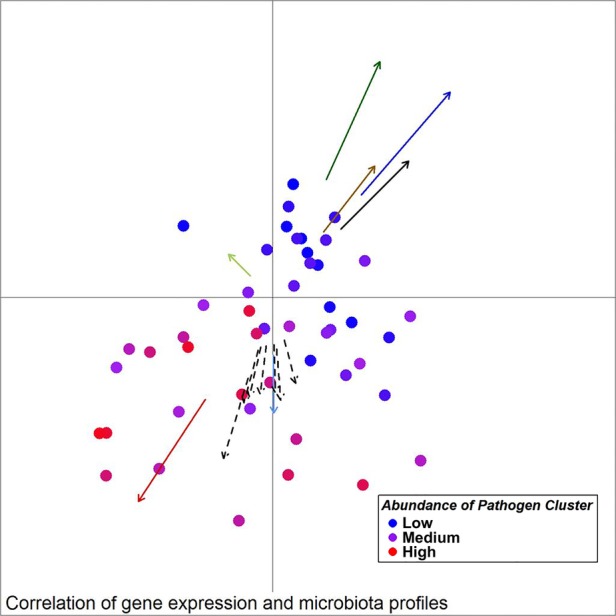
Results: The microbiota of patients with CRC differed from that of controls, but alterations were not restricted to the cancerous tissue. Differences between distal and proximal cancers were detected and faecal microbiota only partially reflected mucosal microbiota in CRC. Patients with CRC can be stratified based on higher level structures of mucosal-associated bacterial co-abundance groups (CAGs) that resemble the previously formulated concept of enterotypes. Of these, Bacteroidetes Cluster 1 and Firmicutes Cluster 1 were in decreased abundance in CRC mucosa, whereas Bacteroidetes Cluster 2, Firmicutes Cluster 2, Pathogen Cluster and Prevotella Cluster showed increased abundance in CRC mucosa. CRC-associated CAGs were differentially correlated with the expression of host immunoinflammatory response genes.

Conclusions: CRC-associated microbiota profiles differ from those in healthy subjects and are linked with distinct mucosal gene-expression profiles. Compositional alterations in the microbiota are not restricted to cancerous tissue and differ between distal and proximal cancers.

Keywords: COLORECTAL CANCER; GENE EXPRESSION; INTESTINAL MICROBIOLOGY.


Conflict of interest statement

Competing interests: None declared.

Figures

Figure 1
Figure 1
Unweighted UniFrac principal component analysis; the microbiota of healthy controls, individuals with polyps and individuals with cancer (A) as well as from individuals with distal, including rectal, and proximal cancers (C) was significantly different; no difference was found in microbiota composition of tumour and paired non-tumour tissues (B); the faecal microbiota of both cancer and control individuals was different from the mucosal microbiota (D). CRC, colorectal cancer.
Figure 2
Figure 2
Hierarchical Ward-linkage clustering based on the Pearson correlation coefficients of the relative abundance of operational taxonomic units in mucosal microbiota of 59 individuals with colorectal cancer (CRC) and 56 healthy controls. Co-abundance groups (CAGs) were defined on the basis of the clusters in the vertical tree and named after their most notable characteristic. Column colour coding is according to legend below. Row colour coding is according to legend on the left. To the right, the most abundant bacterial genera as well as the most strongly connected genera in each CAG (ie, genera with the highest numbers of significant positive correlations with other members of each respective group) are listed. HC, healthy control.
Figure 3
Figure 3
Boxplots of relative abundances of the six co-abundance groups (CAGs), named bacterial clusters in the following. Four clusters (Bacteroidetes Cluster 2 (p<0.1), Firmicutes Cluster 2, Pathogen Cluster and Prevotella Cluster) were of significantly increased abundance in individuals with colorectal cancer (CRC) (59 individuals with CRC, 21 individuals with polyps, 56 healthy controls). Two clusters (Firmicutes Cluster 1 and Bacteroidetes Cluster 1) were of significantly decreased abundance (A). Bacteroidetes Cluster 2 and Pathogen Cluster, Firmicutes Cluster 2 and Prevotella Cluster were most often more abundant in individuals with distal cancers and proximal cancers, respectively (B). ***p value<0.001; **p value<0.01; *p value <0.05; p value <0.1.
Figure 4
Figure 4
Hierarchical Ward-linkage clustering based on the Pearson correlation coefficients of the relative abundance of co-abundance groups (CAGs) in colorectal cancer (CRC) samples (59 individuals). p Values for significant correlations are shown in table 1. HC, healthy control.
Figure 5
Figure 5
Unweighted UniFrac principal component analysis (PCoA) (mucosa associated microbiota of 59 individuals with colorectal cancer and 56 healthy controls). The location of samples on the PCoA is strongly associated with α-diversity and abundance of the bacterial co-occurrence clusters as defined in figure 2. Arrows indicate the direction of correlations for α-diversity (black) and bacterial co-occurrence networks (colours as in figure 2) with location on the PCoA. The distance from the origin and the direction correspond to the vector of x- and y-axis Spearman-correlation coefficient.
Figure 6
Figure 6
Hierarchical Ward-linkage clustering of biopsy samples based on the Pearson correlation of the abundance of bacterial co-occurrence clusters in each sample (59 individuals with colorectal cancer (CRC) and 56 healthy controls). Four distinct groups of samples were defined. Sample Group 1 and Sample Group 2 only comprises individuals with cancer and display high abundances of the Pathogen Cluster and the Prevotella Cluster, respectively. Sample Group 3 contains mostly samples from healthy controls, which have a high relative abundance of Firmicutes Cluster 1. Sample Group 4 comprises 60% individuals with cancer with high relative abundances of Bacteroidetes Clusters 1 and 2. Firmicutes Cluster 2 was found to be most abundant in individuals with CRC from Sample Groups 3 and 4. Column annotation: cancer biopsy (blue) and control biopsy (red).
Figure 7
Figure 7
Schematic representation of relative abundance distribution for each bacterial co-occurrence cluster (colours bars as defined in figure 2) in each Sample Group (figure 6). Clear differences in relative abundance for each bacterial cluster in each Sample Group are evident. Additionally, individuals in Sample Group 1 were associated with low α-diversity, whereas individuals in Sample Groups 3 and 4 were associated with high α-diversity. Significant difference for each Sample Group compared with each other Sample Group in terms of α-diversity is indicated above bar. Brackets indicate p<0.1.
Figure 8
Figure 8
Network plots of operational taxonomic units (OTUs) based on the mucosal abundance of each OTU in 59 individuals with colorectal cancer and 56 healthy controls. (A) Each node (circle) represents a bacterial OTU. The size of each node correlates to the mean abundance of each OTU across all samples. (B–D) Nodes (OTUs) are shown if the abundance of the respective OTU was significantly correlated with the expression of IL-17a (B), IL-8 (C) or IL-23 (D). Upward facing triangle: positive correlation; downward facing triangle: negative correlation. (A–D) The width of each edge corresponds to the p value of the correlation between each respective node (lower p value, higher line-width). The location of each node was determined by a principal component analysis of the correlation distance as described in ‘Material and methods’ section. Colour of each node according to the co-abundance groups as in figure 2.
Figure 9
Figure 9
Unweighted UniFrac principal component analysis (PCoA) of mucosal microbiota associated with samples from individuals with colorectal cancer (30 ON samples, 18 OFF samples). Arrows indicate the direction of correlations for the expression of several genes possibly indicative of a TH17 response (CCL20, IL-17a) as well as other interleukins, CXCL1, MMP13 and SERP1 (dashed arrows, p value <0.1), α-diversity (black) and bacterial co-occurrence networks (colours as in figure 2) with location on the PCoA plot. The distance from the origin and the direction corresponds to the vector of x- and y-axis correlation. Colour of circles represents abundance of the Pathogen Cluster in each sample (red: high, blue: low).

Comment in

References

    1. Burt RW. Colon cancer screening. Gastroenterology 2000;119:837–53. 10.1053/gast.2000.16508 - DOI - PubMed
    1. Haggar FA, Boushey RP. Colorectal Cancer Epidemiology: Incidence, Mortality, Survival, and Risk Factors. Clin Colon Rectal Surg 2009;22:191–7. 10.1055/s-0029-1242458 - DOI - PMC - PubMed
    1. Abreu MT, Peek RM Jr. Gastrointestinal malignancy and the microbiome. Gastroenterology, the gut microbiome in health and disease. Gastroenterology 2014;146:1534–1546.e3. 10.1053/j.gastro.2014.01.001 - DOI - PMC - PubMed
    1. Sears CL, Garrett WS. Microbes, microbiota, and colon cancer. Cell Host Microbe 2014;15:317–28. 10.1016/j.chom.2014.02.007 - DOI - PMC - PubMed
    1. Wu S, Rhee KJ, Albesiano E, et al. . A human colonic commensal promotes colon tumorigenesis via activation of T helper type 17T cell responses. Nat Med 2009;15:1016–22. 10.1038/nm.2015 - DOI - PMC - PubMed

Publication types

MeSH terms