. 2016 Mar 18:17:133.
doi: 10.1186/s12859-016-0945-5.

Characterization of multiple sequence alignment errors using complete-likelihood score and position-shift map

Affiliations

Characterization of multiple sequence alignment errors using complete-likelihood score and position-shift map

Kiyoshi Ezawa. BMC Bioinformatics. .

Abstract

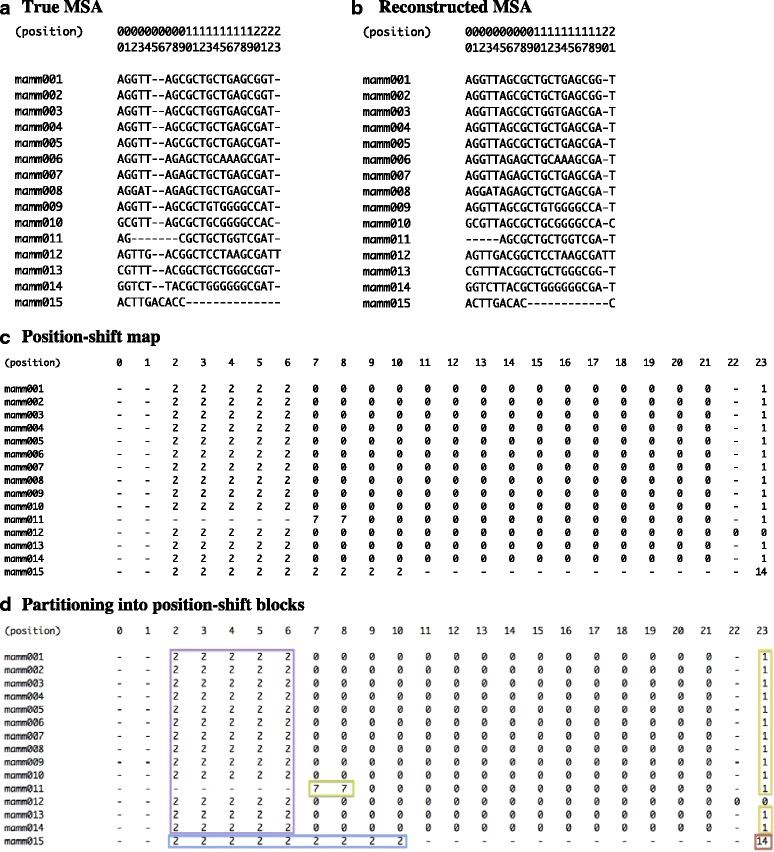
Background: Reconstruction of multiple sequence alignments (MSAs) is a crucial step in most homology-based sequence analyses, which constitute an integral part of computational biology. To improve the accuracy of this crucial step, it is essential to better characterize errors that state-of-the-art aligners typically make. For this purpose, we here introduce two tools: the complete-likelihood score and the position-shift map.

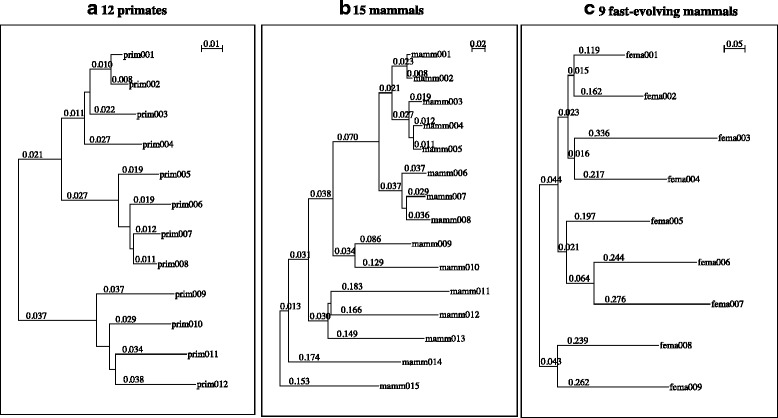
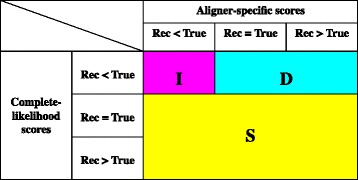
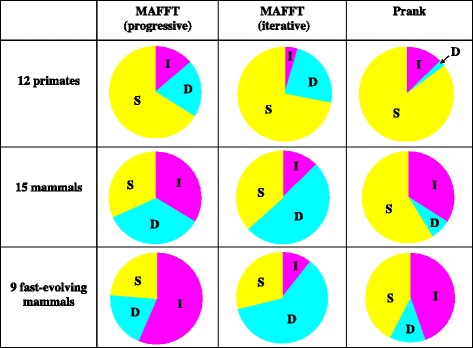
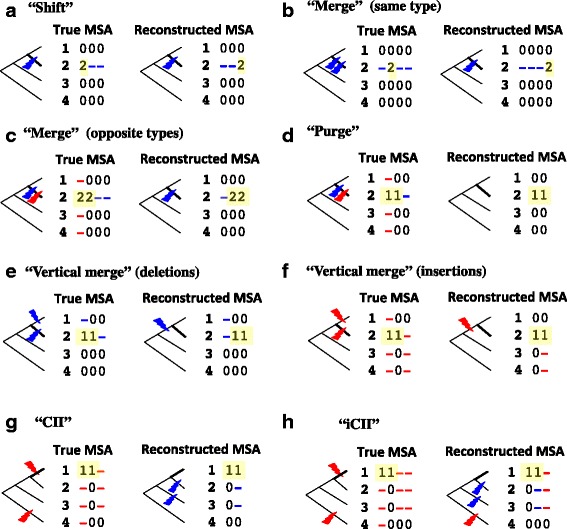
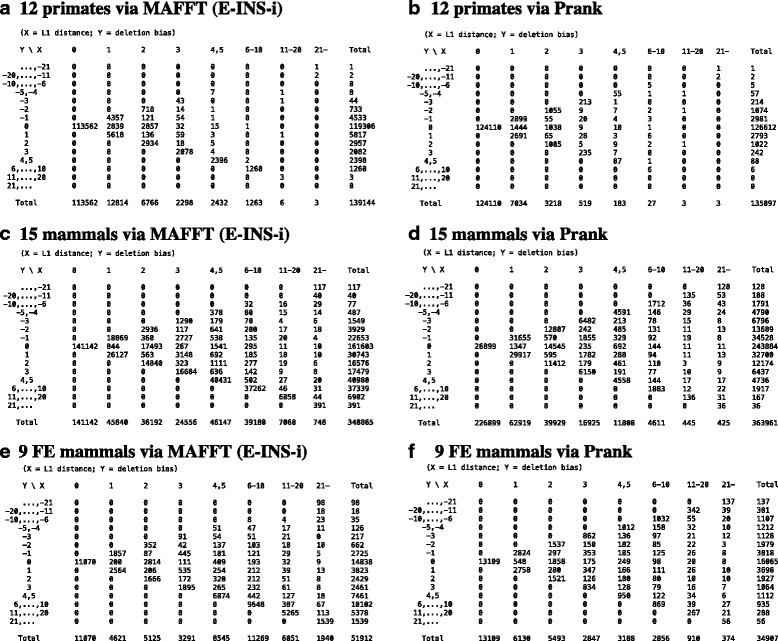
Results: The logarithm of the total probability of a MSA under a stochastic model of sequence evolution along a time axis via substitutions, insertions and deletions (called the "complete-likelihood score" here) can serve as an ideal score of the MSA. A position-shift map, which maps the difference in each residue's position between two MSAs onto one of them, can clearly visualize where and how MSA errors occurred and help disentangle composite errors. To characterize MSA errors using these tools, we constructed three sets of simulated MSAs of selectively neutral mammalian DNA sequences, with small, moderate and large divergences, under a stochastic evolutionary model with an empirically common power-law insertion/deletion length distribution. Then, we reconstructed MSAs using MAFFT and Prank as representative state-of-the-art single-optimum-search aligners. About 40-99% of the hundreds of thousands of gapped segments were involved in alignment errors. In a substantial fraction, from about 1/4 to over 3/4, of erroneously reconstructed segments, reconstructed MSAs by each aligner showed complete-likelihood scores not lower than those of the true MSAs. Out of the remaining errors, a majority by an iterative option of MAFFT showed discrepancies between the aligner-specific score and the complete-likelihood score, and a majority by Prank seemed due to inadequate exploration of the MSA space. Analyses by position-shift maps indicated that true MSAs are in considerable neighborhoods of reconstructed MSAs in about 80-99% of the erroneous segments for small and moderate divergences, but in only a minority for large divergences.

Conclusions: The results of this study suggest that measures to further improve the accuracy of reconstructed MSAs would substantially differ depending on the types of aligners. They also re-emphasize the importance of obtaining a probability distribution of fairly likely MSAs, instead of just searching for a single optimum MSA.

Keywords: Error; Insertion/deletion (indel); Likelihood; MSA space exploration; Multiple sequence alignment (MSA); Power-law; Probability distribution; Stochastic evolutionary model; Visualization.


Figures

Fig. 1
Fig. 1
Example position-shift map. a A true MSA, which was created by a simulation along the tree in Fig. 2b. b A reconstructed MSA. In the position-shift map (c), each site of each sequence is occupied by the residue’s horizontal position in the reconstructed MSA minus that in the true MSA. d Partitioning the map into position-shift blocks (enclosed by colored boxes). Each of the yellow and green blocks (with shifts 7 and 1, respectively,) was associated with a “shift.” The blue block (with shift 2) and the red one (with shift 14) were paired and associated with a “merge + shift.” The purple one (with shift 2) was judged as accompanying the blue one to result in the “merge.” [NOTE: The rectangles in panel d were drawn manually, based on the output of a prototype script to parse a position-shift map.]
Fig. 2
Fig. 2
Phylogenetic trees used for simulated DNA sequence evolution. a The tree of 12 primates. b The tree of 15 mammals. c The tree of 9 fast-evolving mammals. The number along each branch is its length (in the expected number of substitutions per 4-fold degenerate site). Additional file 1: Table S1 associates the sequence IDs with species names
Fig. 3
Fig. 3
Definitions of three broad score categories, “D,” “I” and “S.” The “<,” “=“and “>” represent the results of the comparisons of the scores of the two MSAs. The “Rec” and “True” stand for the score of the reconstructed MSA and that of the true MSA, respectively. See the text for the rationale underlying these definitions of the categories
Fig. 4
Fig. 4
Proportions of three broad score categories. Each pie chart shows the proportions of 3 broad score categories, I (magenta), D (cyan) and S (yellow), in a particular MSA set (row) via a specified alignment method (column). The specific “progressive” and “iterative” options of MAFFT are E-INS-1 and E-INS-i, respectively. For the definitions of the 3 categories, see Fig. 3. For numerical values of the proportions and the absolute frequencies, see Additional file 1: Table S2
Fig. 5
Fig. 5
“Elementary” MSA errors associated with single position-shift blocks. The figure schematically illustrates a “shift” [(a)], a “merge” of the events of the same type [(b)], a “merge” of the events of opposite types [(c)], a “purge” [(d)], a “vertical merge” of two deletions [(e)], a “vertical merge” of two insertions [(f)], a “collapse of independent insertions (CII)” [(g)], and an “incomplete collapse of independent insertions (iCII)” [(h)]. In each panel, the tree and the position-shift map on the left are for the true MSA, and those on the right are for the reconstructed MSA. In each position-shift map, the position-shift block is highlighted in yellow, a red gap was derived from an (spurious) insertion, and a blue gap was derived from a (spurious) deletion. On each tree, the thick branch delimits the position-shift block, and a red lightning bolt and a blue lightning bolt represent an insertion and a deletion, respectively, any of which may be spurious
Fig. 6
Fig. 6
Different features of indel count misestimations by MAFFT (iterative) and Prank. a,c,e Via MAFFT, E-INS-i (i.e., iterative). b,d,f Via Prank. a,b With 12 primates. c,d With 15 mammals. e,f With 9 fast-evolving (FE) mammals. Each panel shows a 2-dimensional distribution of two measures of indel count misestimations, namely, the L1 distance (abscissa) and the deletion bias (ordinate). See section M8 of Methods for the definitions of the measures. Each of the integers is the count of erroneous segments whose L1 distance and deletion bias belong to the specified classes

References

    1. Felsenstein J. Evolutionary trees from DNA sequences: a maximum likelihood approach. J Mol Evol. 1981;17:368–76. doi: 10.1007/BF01734359. - DOI - PubMed
    1. Felsenstein J. Inferring phylogenies. Sunderland (MA): Sinauer Associates; 2004.
    1. Arnold K, Bordoli L, Kopp J, Schwede T. The SWISS-MODEL workspace: a Web-based environment for protein structure homology modeling. Bioinformatics. 2006;22:195–201. doi: 10.1093/bioinformatics/bti770. - DOI - PubMed
    1. Eisen JA. Phylogenomics: improving functional predictions for uncharacterized genes by evolutionary analysis. Genome Res. 1998;8:163–87. doi: 10.1101/gr.8.3.163. - DOI - PubMed
    1. Finn RD, Mistry J, Tate J, Coggill P, Heger A, Pollington JE, et al. The Pfam protein families database. Nucleic Acids Res. 2009;38:D211–22. doi: 10.1093/nar/gkp985. - DOI - PMC - PubMed

Publication types

LinkOut - more resources