. 2016 Aug;8(4):338-48.
doi: 10.1093/jmcb/mjw009. Epub 2016 Mar 18.

Kindlin1 regulates microtubule function to ensure normal mitosis

Affiliations

Kindlin1 regulates microtubule function to ensure normal mitosis

Hitesh Patel et al. J Mol Cell Biol. 2016 Aug.

Abstract

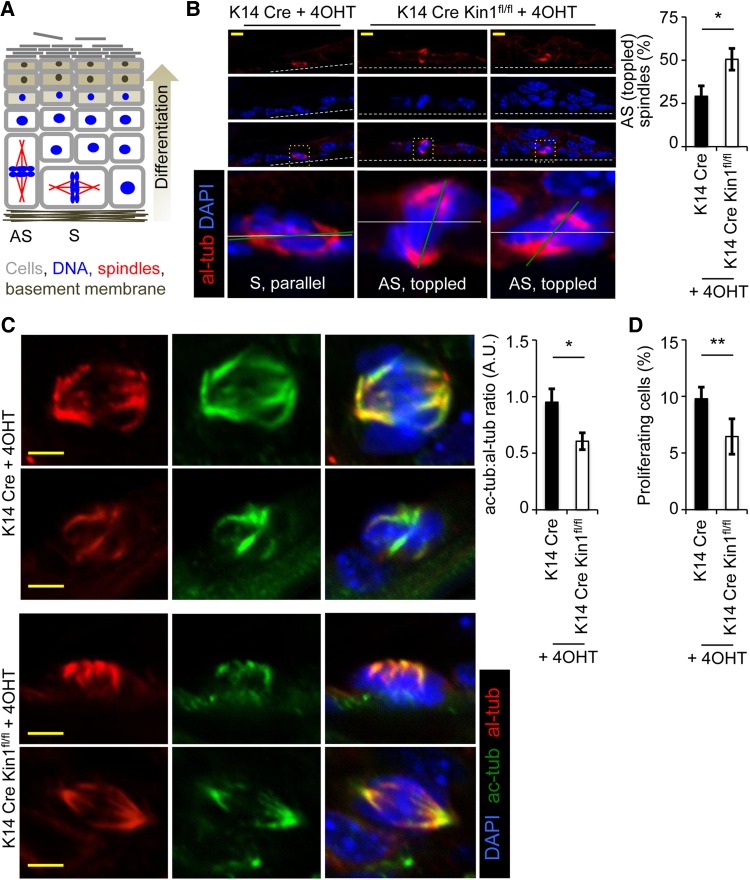
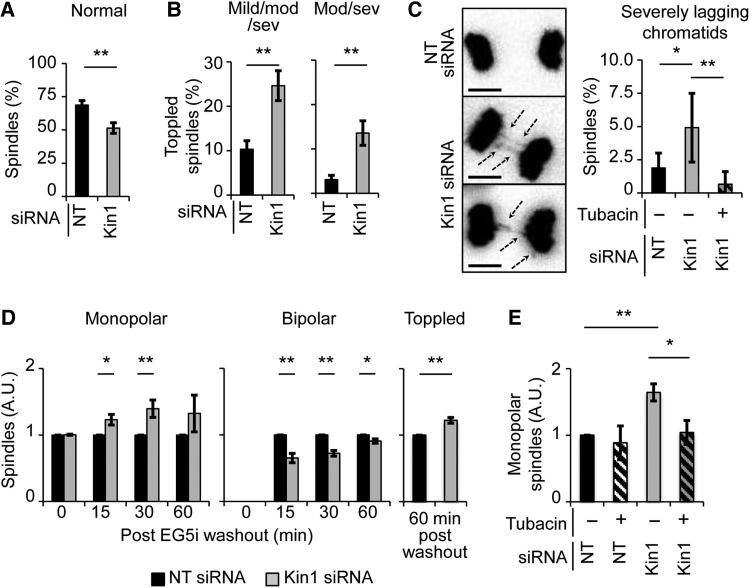
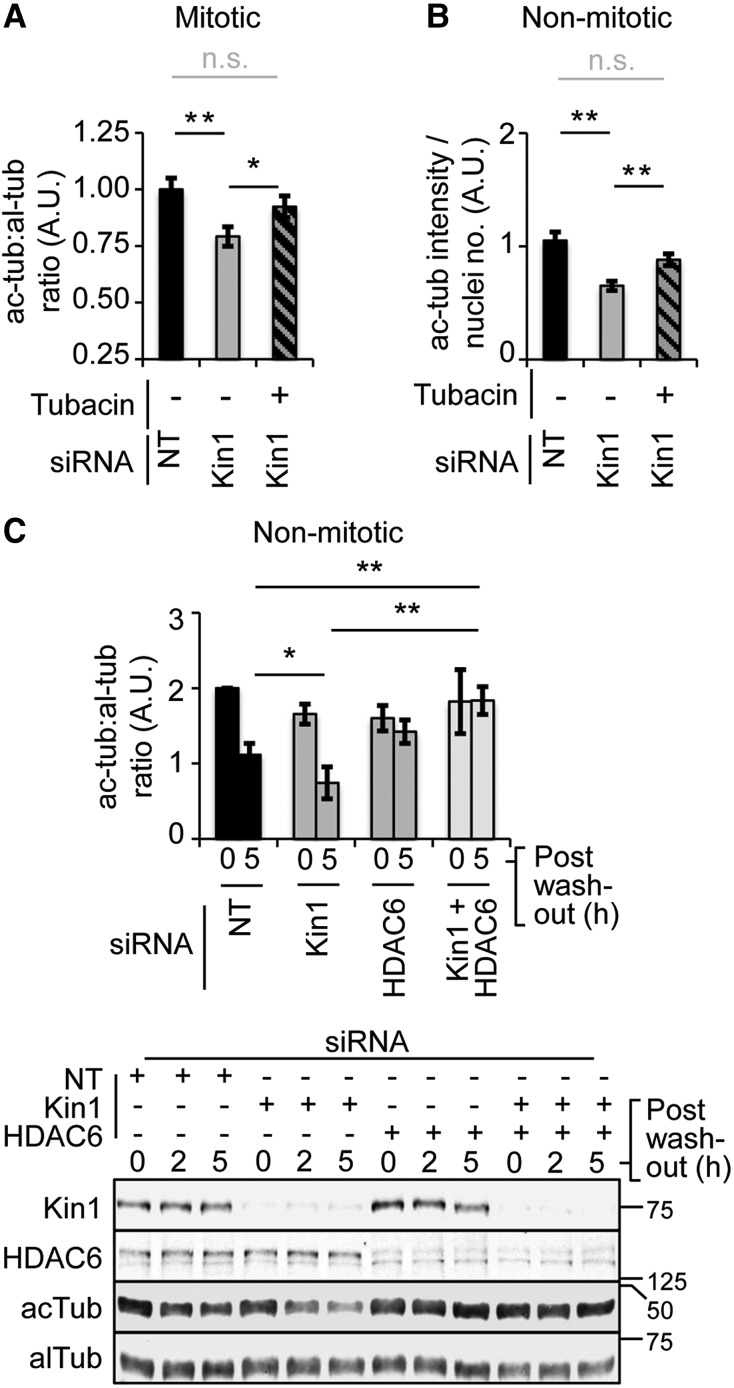
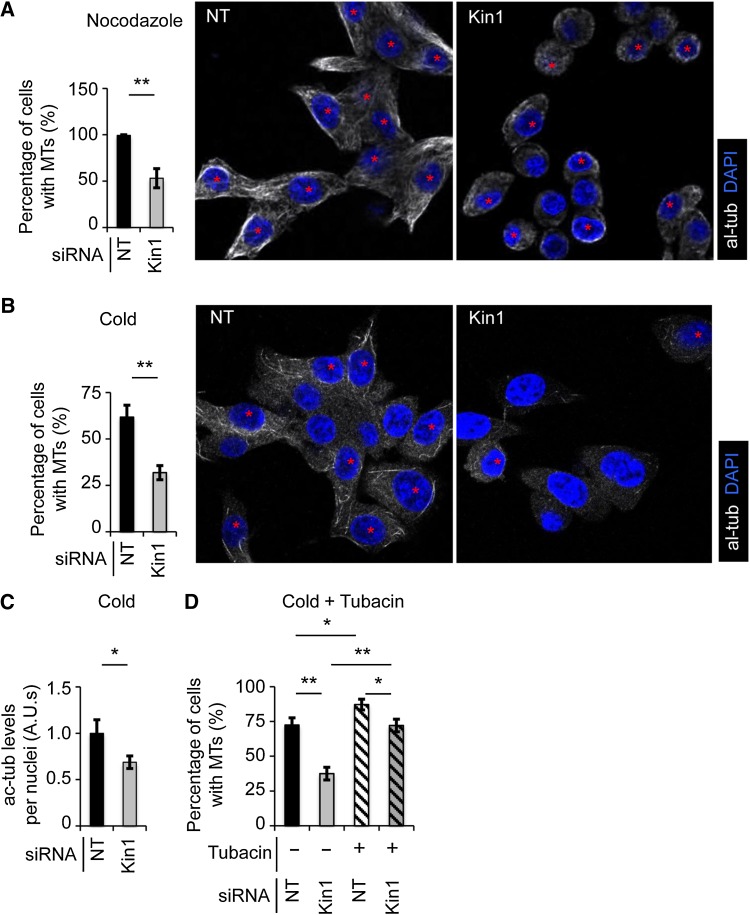
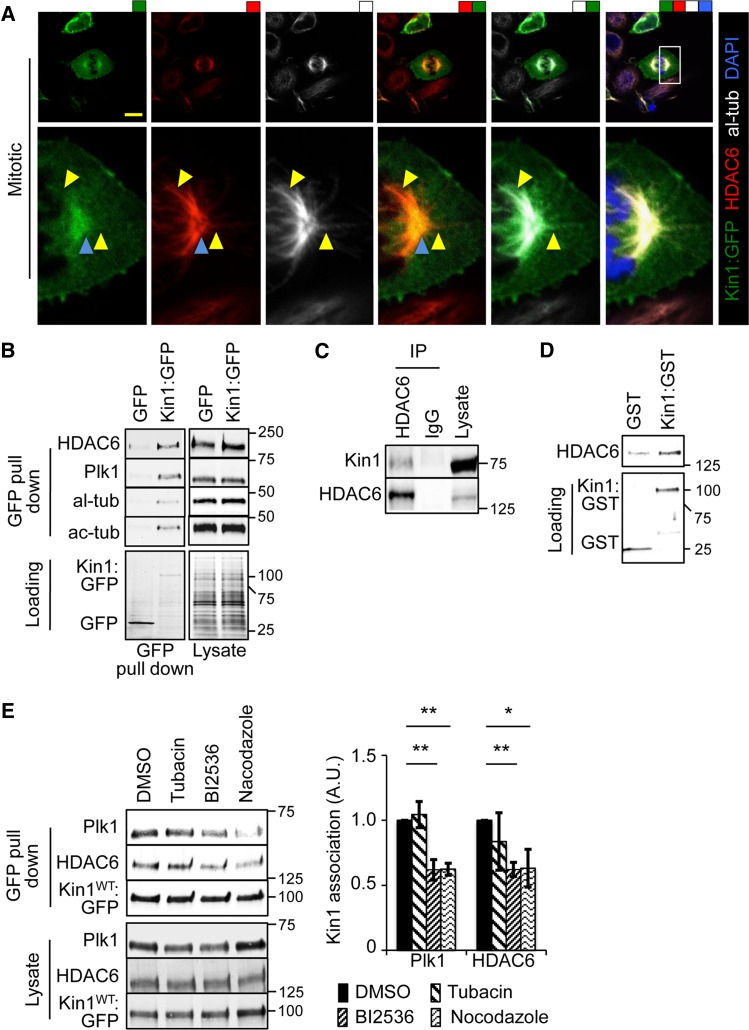
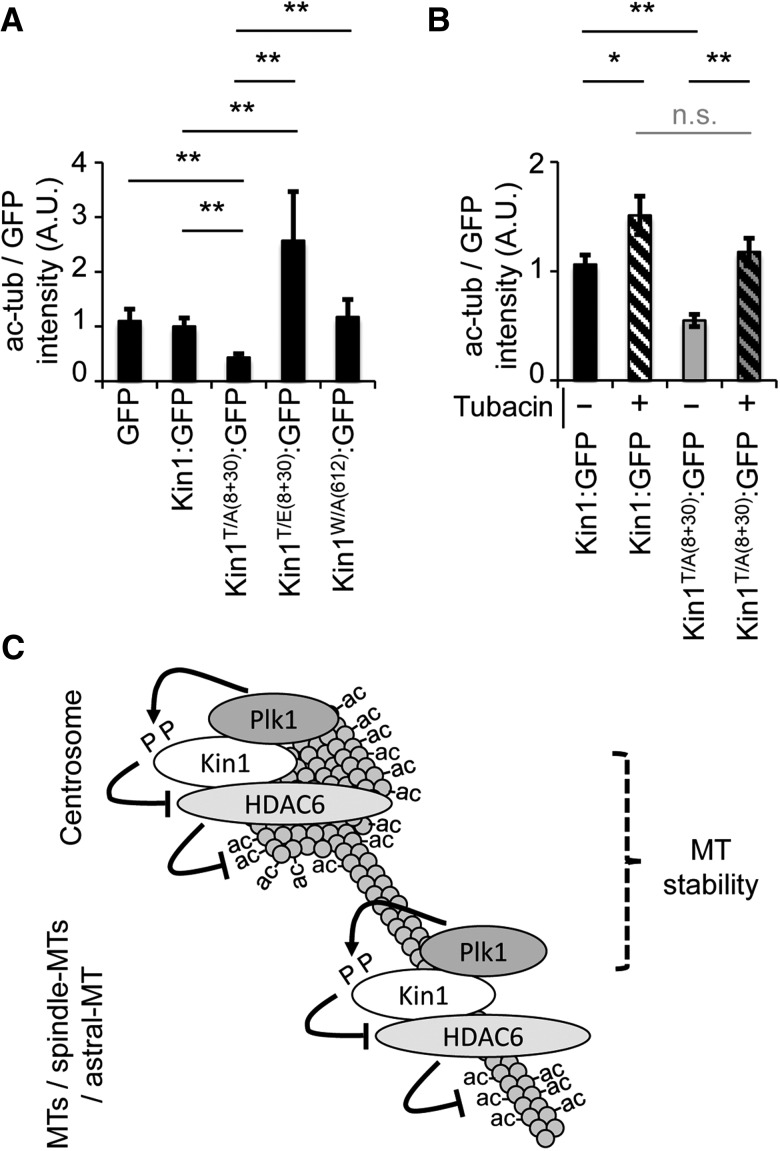
Loss of Kindlin 1 (Kin1) results in the skin blistering disorder Kindler Syndrome (KS), whose symptoms also include skin atrophy and reduced keratinocyte proliferation. Kin1 binds to integrins to modulate their activation and more recently it has been shown to regulate mitotic spindles and cell survival in a Plk1-dependent manner. Here we report that short-term Kin1 deletion in mouse skin results in impaired mitosis, which is associated with reduced acetylated tubulin (ac-tub) levels and cell proliferation. In cells, impaired mitosis and reduced ac-tub levels are also accompanied by reduced microtubule stability, all of which are rescued by HDAC6 inhibition. The ability of Kin1 to regulate HDAC6-dependent cellular ac-tub levels is dependent on its phosphorylation by Plk1. Taken together, these data define a novel role for Kin1 in microtubule acetylation and stability and offer a mechanistic insight into how certain KS phenotypes, such as skin atrophy and reduced cell proliferation, arise.

Keywords: HDAC6; Kindlin1; Plk1; microtubules; mitosis.


Figures

Figure 1
Figure 1
Kin1 deletion in vivo results in abnormal mitosis, decreased ac-tub, and decreased cell proliferation. (A) Schematic representation of asymmetrical (AS) and symmetrical (S) cell division in the epidermis (adapted from Poulson and Lechler, 2010). Analysis of control (K14Cre) and Kin1-deleted (K14Cre Kin1fl/fl) mouse epidermis. (B) Representative images (left) of mitotic cells and quantification of asymmetrical spindles (right). (C) Representative images (left) of al-tub and ac-tub and quantification (right). (D) Percentage of phospho-histone H3-positive cells. In all graphs shown, n ≥ 3, error bars are ± SEM. P-values, t-test, *<0.05 and **<0.01.
Figure 2
Figure 2
Kin1 regulates mitosis in an HDAC6-dependent manner. (A–C) Analysis of NT and Kin1 siRNA-treated mitotic cells using live cell imaging of His2B:DsRed. For control and Kin1 depleted conditions, >250 mitotic cells were observed; for the Kin1 depleted + tubacin condition, >150 mitotic cells were observed. (A) Percentage of cells undergoing normal mitosis. (B) Percentage of cells undergoing mildly, moderately, or severely toppled mitosis (left) and undergoing moderately or severely toppled mitosis (right). (C) Representative images (left) and quantification (right) of lagging chromosomes. (D) Quantification of monopolar (left), bipolar (middle), and toppled (right) spindles after release from EG5 inhibition in NT and Kin1 siRNA-treated cells. (E) Quantification of monopolar spindles at 30 min post-EG5i washout ± tubacin. For D and E, >250 mitotic cells were observed. In all graphs shown, n ≥ 3, error bars are ± SEM. P-values, t-test, *<0.05 and **<0.01.
Figure 3
Figure 3
Kin1 regulates ac-tub levels in an HDAC6-dependent manner. (A) al-tub and ac-tub levels were determined in NT and Kin1 siRNA ± tubacin-treated mitotic cells by quantification of immunofluorescence images. The double thymidine block and release protocol was used to enrich for mitotic cells. (B) ac-tub levels in non-mitotic cells were determined 45 min after disruption of the MT cytoskeleton in MT regrowth assays by quantification of immunofluorescence images in NT or Kin1 siRNA ± tubacin-treated cells. For A and B, >250 cells were measured. (C) ac-tub and al-tub levels determined 0 and 5 h after tubacin washout by quantification of western analysis in cells treated with siRNAs as indicated (top). Representative western blots from which al-tub and ac-tub levels were determined and siRNA depletion confirmed are shown (bottom). In all graphs shown, n ≥ 3, error bars are ±SEM. P-values, t-test, *<0.05, **<0.01, n.s. = not significant.
Figure 4
Figure 4
Kin1 regulates MT stability. Representative images (right) show the presence of multiple robust MTs in cells (red asterisk) after nocodazole (A) or cold (B) treatment, quantified as a percentage of the total number of cells (left). (C) ac-tub levels were determined in NT and Kin1 siRNA-treated cells after cold treatment. (D) The presence of multiple and robust MTs after cold treatment ± tubacin in cells, quantified as a percentage of the total number of cells. In all graphs shown, n ≥ 3, >250 cells were scored and error bars are ±SEM. P-values, t-test, *<0.05 and **<0.01.
Figure 5
Figure 5
Kin1 localizes with HDAC6 at centrosomes and their association is dependent on Plk1 activity and MTs. (A) Kin1:GFP co-localizes with al-tub and HDAC6 at centrosomes (blue arrowheads) and along MT (yellow arrowheads). (B) GFP pull downs from lysates of cells expressing Kin1:GFP or GFP were probed with the indicated antibodies. (C) Lysates were immunoprecipitated with anti-HDAC6 antibody and probed with Kin1 and HDAC6 antibodies. (D) In vitro binding assay of recombinant HDAC6 with either GST:Kin1 or GST. (E) GFP pull downs from lysate of cells expressing Kin1:GFP in the presence of DMSO, tubacin, BI2536, or nocodazole. In all graphs shown, n ≥ 3, error bars are ±SEM. P-values, t-test, *<0.05 and **<0.01.
Figure 6
Figure 6
Plk1 phosphorylation of Kin1 modulates its ability to regulate ac-tub levels via HDAC6. (A and B) Ac-tub levels were determined 45 min after disruption of the MT cytoskeleton in MT regrowth assays in cells expressing GFP or GFP fused to indicated Kin1 mutants (A) ±tubacin (B). (C) A simplified schematic summarizes the interplay between Kin1, Plk1, and HDAC6 in their regulation of MT acetylation and stability. In all graphs shown, n ≥ 3, >250 cells were measured and error bars are ±SEM. P-values, t-test, *<0.05 and **<0.01.

References

    1. Behnke O., Forer A. (1967). Evidence for four classes of microtubules in individual cells. J. Cell Sci. 2, 169–192. - PubMed
    1. De Clerck F., De Brabander M. (1977). Nocodazole, a new synthetic antimitotic agent, enhances the production of plasminogen activator by cells in culture. Thromb. Res. 11, 913–914. - PubMed
    1. Emanuel P.O., Rudikoff D., Phelps R.G. (2006). Aggressive squamous cell carcinoma in Kindler syndrome. Skinmed 5, 305–307. - PubMed
    1. Harburger D.S., Bouaouina M., Calderwood D.A. (2009). Kindlin-1 and -2 directly bind the C-terminal region of beta integrin cytoplasmic tails and exert integrin-specific activation effects. J. Biol. Chem. 284, 11485–11497. - PMC - PubMed
    1. Lai-Cheong J.E., Tanaka A., Hawche G. et al. (2009). Kindler syndrome: a focal adhesion genodermatosis. Br. J. Dermatol. 160, 233–242. - PubMed

MeSH terms