

Distribution and predictors of emergency department charges: the case of a tertiary hospital in Lebanon
- PMID: 26993108
- PMCID: PMC4797130
- DOI: 10.1186/s12913-016-1337-2
Distribution and predictors of emergency department charges: the case of a tertiary hospital in Lebanon
Abstract
Background: As health care costs continue to increase worldwide, health care systems, and more specifically hospitals are facing continuous pressure to operate more efficiently. One service within the hospital sector whose cost structure has been modestly investigated is the Emergency Department (ED). The study aims to report on the distribution of ED resource use, as expressed in charges, and to determine predictors of/contributors to total ED charges at a major tertiary hospital in Lebanon.
Methods: The study used data extracted from the ED discharge database for visits between July 31, 2012 and July 31, 2014. Patient visit bills were reported under six major categories: solutions, pharmacy, laboratory, physicians, facility, and radiology. Characteristics of ED visits were summarized according to patient gender, age, acuity score, and disposition. Univariate and multivariate analyses were conducted with total charges as the dependent variable.
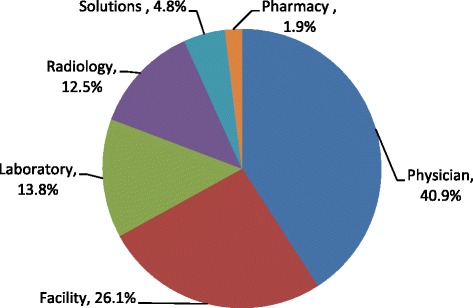
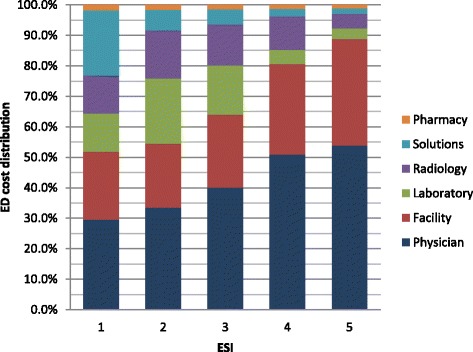
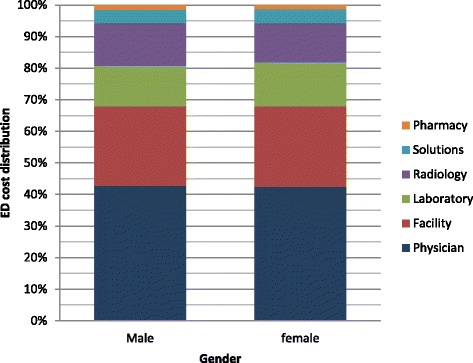
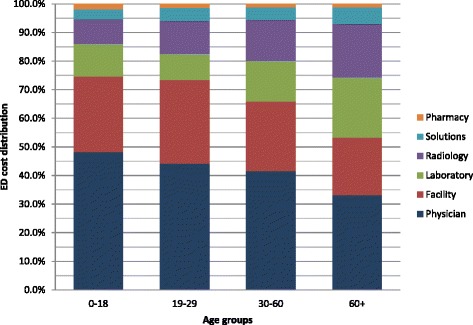
Results: Findings revealed that the professional fee (40.9 %) followed by facility fee (26.1 %) accounted for the majority of the ED charges. While greater than 80 % of visit charges went to physician and facility fee for low acuity cases, these contributed to only 52 and 54 % of the high acuity presentations where ancillary services and solutions' contribution to the total charges increased. The total charges for males were $14 higher than females; age was a predictor of higher charges with total charges of patients greater than 60 years of age being around $113 higher than ages 0-18 after controlling for all other variables.
Conclusion: Understanding the components and determinants of ED charges is essential to developing cost-containment interventions. Institutional modeling of charging patterns can be used to offer price estimates to ED patients who request this information and ultimately help create market competition to drive down costs.
Keywords: Charges; Cost; Cost categories; Emergency department; Lebanon.
Figures
References
-
- Kelly KA. Shifting the cost of caring for patients with nonemergency conditions from crowded emergency departments to primary care settings. J Emerg Nurs. 1994;20(6):454–7. - PubMed
MeSH terms
LinkOut - more resources
Full Text Sources
Other Literature Sources
Research Materials
