. 2017 May;54(4):2562-2578.
doi: 10.1007/s12035-016-9821-6. Epub 2016 Mar 19.

Kainic Acid Induces mTORC1-Dependent Expression of Elmo1 in Hippocampal Neurons

Affiliations

Kainic Acid Induces mTORC1-Dependent Expression of Elmo1 in Hippocampal Neurons

Magdalena Blazejczyk et al. Mol Neurobiol. 2017 May.

Abstract

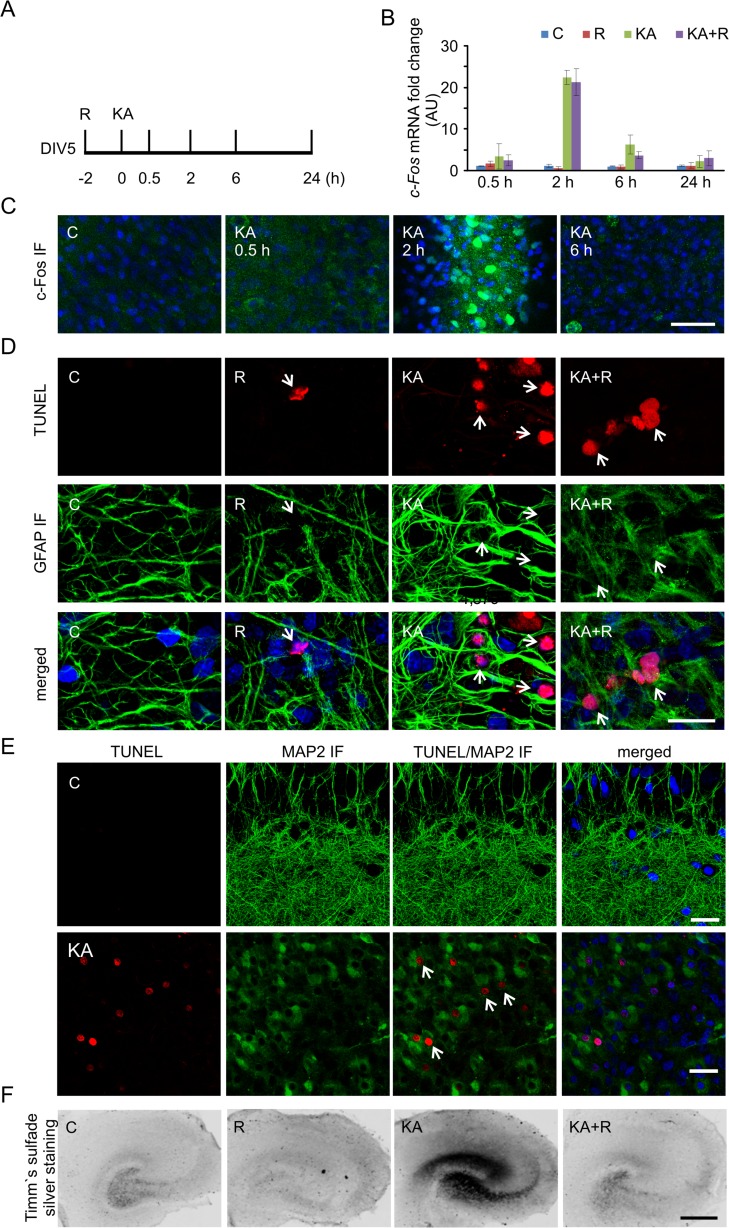
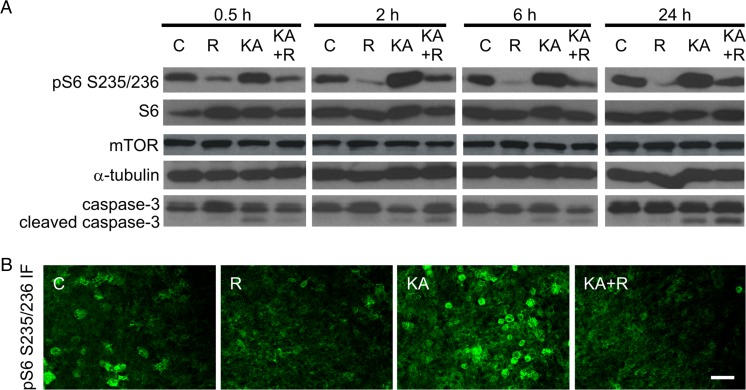
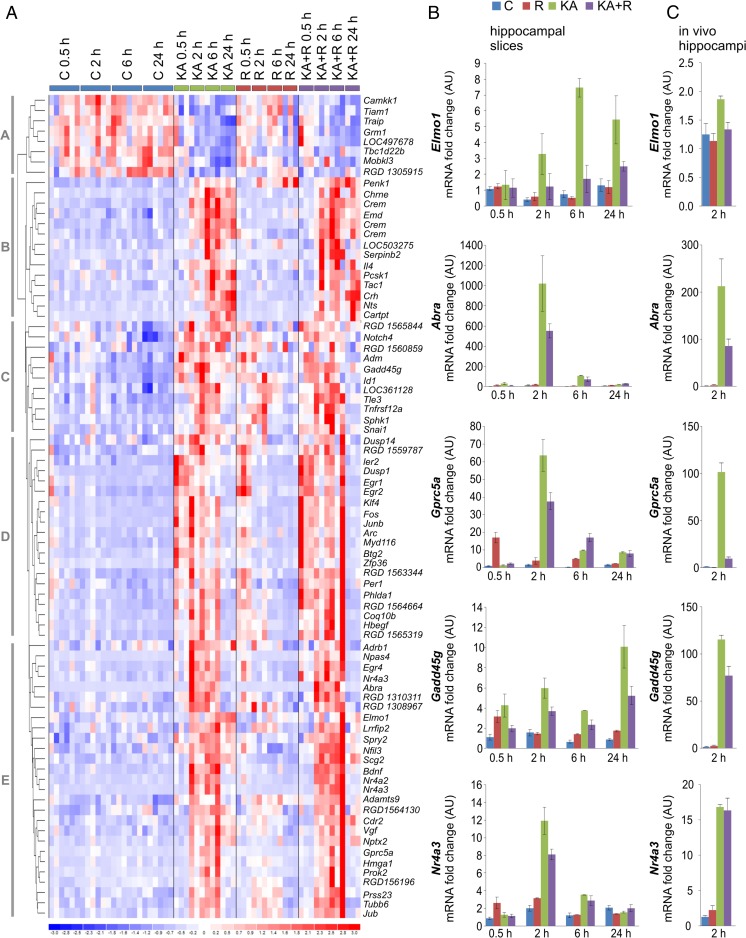
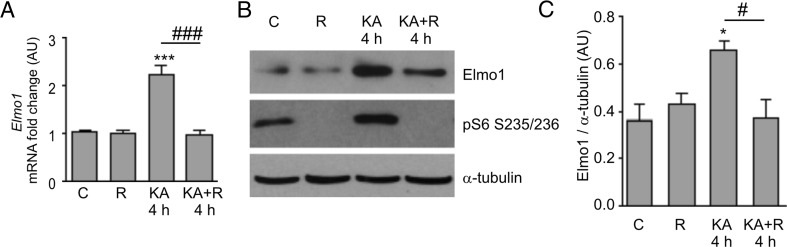
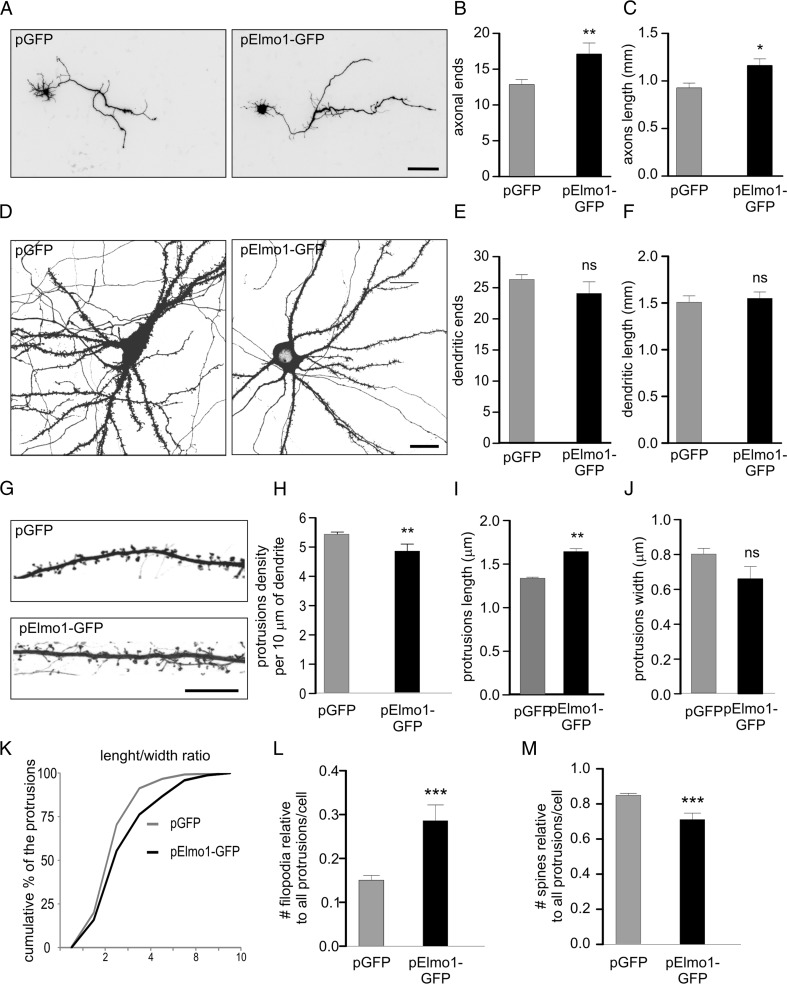
Epileptogenesis is a process triggered by initial environmental or genetic factors that result in epilepsy and may continue during disease progression. Important parts of this process include changes in transcriptome and the pathological rewiring of neuronal circuits that involves changes in neuronal morphology. Mammalian/mechanistic target of rapamycin (mTOR) is upregulated by proconvulsive drugs, e.g., kainic acid, and is needed for progression of epileptogenesis, but molecular aspects of its contribution are not fully understood. Since mTOR can modulate transcription, we tested if rapamycin, an mTOR complex 1 inhibitor, affects kainic acid-evoked transcriptome changes. Using microarray technology, we showed that rapamycin inhibits the kainic acid-induced expression of multiple functionally heterogeneous genes. We further focused on engulfment and cell motility 1 (Elmo1), which is a modulator of actin dynamics and therefore could contribute to pathological rewiring of neuronal circuits during epileptogenesis. We showed that prolonged overexpression of Elmo1 in cultured hippocampal neurons increased axonal growth, decreased dendritic spine density, and affected their shape. In conclusion, data presented herein show that increased mTORC1 activity in response to kainic acid has no global effect on gene expression. Instead, our findings suggest that mTORC1 inhibition may affect development of epilepsy, by modulating expression of specific subset of genes, including Elmo1, and point to a potential role for Elmo1 in morphological changes that accompany epileptogenesis.

Keywords: Elmo1; Epilepsy; Gene expression; Rapamycin; mTORC1.


Conflict of interest statement

The authors declare that they have no competing interests.

Figures

Fig. 1
Fig. 1
In vitro model system to study molecular and cellular responses to kainic acid. a Scheme of rat organotypic hippocampal slice treatments with kainic acid (KA) and rapamycin (R). b Expression of c-Fos mRNA after KA treatment analyzed by qRT-PCR. C control, R rapamycin, KA kainic acid, KA+R kainic acid+rapamycin. Number of cultures (N) = 3, number of slices per condition per culture = 4. c Representative confocal images of CA1/CA3 area of organotypic hippocampal slices immunofluorescently stained for c-Fos (green) after KA at the indicated time points. Nuclei were counterstained with Hoechst 33342 (blue). Scale bar = 50 μm. d Representative confocal images of CA1/CA3 area of organotypic hippocampal slice TUNEL staining (red) 24 h after indicated treatment. Slices were additionally immunofluorescently stained with the glial marker GFAP (green) and counterstained with nuclear dye Hoechst 33342 (blue). Scale bar = 20 μm. e Representative confocal images of CA1/CA3 area of organotypic hippocampal slice TUNEL staining (red) 24 h after indicated treatment. Slices were additionally immunofluorescently stained with the neuronal marker MAP2 (green) and counterstained with nuclear dye Hoechst 33342 (blue). Scale bar = 20 μm. f Representative images of organotypic hippocampal slice with Timm’s staining treated as indicated. Scale bar = 500 μm (color figure online)
Fig. 2
Fig. 2
Kainic acid induces mTOR activity and cell death in organotypic hippocampal slices. a Western blot analysis of phosphorylated ribosomal protein S6 (P-S6; Ser235/236), mTOR, caspase-3, and cleaved caspase-3 in protein lysates obtained from organotypic slices treated as indicated. α-Tubulin is shown as a loading control. C control, R rapamycin, KA kainic acid, KA+R kainic acid+rapamycin. b Representative confocal images of CA1/CA3 area of organotypic hippocampal slice immunofluorescently stained for P-S6 2 h after R, KA, or KA+R treatment. Scale bar = 50 μm
Fig. 3
Fig. 3
Hierarchical clustering of transcriptional alterations in response to KA in rat hippocampal slices and validation of selected gene expression changes. a Microarray results are shown as a heat map and include rat genes with genome-wide significance (two-way ANOVA of KA effects; FDR < 1 %). Colored rectangles represent transcript abundance of the genes labeled on the right. Gene expression was measured 0.5, 2, 6, and 24 h after KA, rapamycin (R), or KA+R treatments. The experimental groups are indicated above the heat map. The intensity of the color is proportional to the standardized values (between −3 and 3) from each microarray as indicated on the bar below the map image. Clustering was performed using Euclidean distance according to the scale on the left. KA-regulated genes were segregated into five time-dependent gene clusters (AE). b Results of qRT-PCR-based analysis of indicated gene expression in organotypic hippocampal slices treated as indicated. The data are presented as mRNA fold changes relative to the control ± standard error (number of cultures [N] = 3; number of slices per culture: C, n = 16; R, n = 8; KA, n = 8; KA+R, n = 8. c Results of qRT-PCR-based analysis of indicated gene expression in hippocampi of rats treated as described in [11]. The data are presented as mRNA fold changes relative to the control ± standard error (number of animals: C, n = 3; R, n = 5; KA, n = 3; KA+R, n = 5)
Fig. 4
Fig. 4
Kainic acid-induced Elmo1 expression is mTOR-dependent in cultured cortical neurons. a Results of qRT-PCR-based analysis of Elmo1 expression in cortical neurons cultured in vitro for 5 days and treated as indicated (C control, R rapamycin, KA kainic acid, KA+R KA+rapamycin). The data are presented as mRNA fold changes relative to the control ± standard error (number of cultures N = 5). Significant differences in transcript abundance between the treatments and controls are indicated by asterisks (***p < 0.001). Significant differences in transcript abundance between KA and KA+sR are indicated by hash signs (### p < 0.001; one-way ANOVA followed by Sidak’s multiple comparisons test). b Representative result of Western blot analysis of Elmo1 expression in cortical neurons cultured in vitro for 14 days and treated as indicated. c Quantitative analysis of Western blot of Elmo1 expression levels in cortical neurons cultured in vitro for 14 days and treated as indicated (number of cultures N = 5). α-Tubulin levels were used for normalization. Significant differences in protein abundance between the treatments and controls are indicated by asterisks (*p < 0.05). Significant differences in protein abundance between KA and KA+R are indicated by hash signs (# p < 0.05; one-way ANOVA followed by Sidak’s multiple comparisons test)
Fig. 5
Fig. 5
Elmo1 overexpression in hippocampal neurons affects axonal growth and dendritic spine morphology and density. a Representative confocal images of hippocampal neurons transfected on DIV1 with a plasmid that encoded GFP or Elmo1-GFP and fixed 3 days later. β-Actin-tdTomato was cotransfected to highlight transfected cell morphology. b Number of axonal ends and c axonal length of cells transfected as in a. *p < 0.05, **p < 0.01 (Mann–Whitney test). Cell images were obtained from three independent culture batches. Number of cells (n): GFP, n = 70; Elmo1-GFP, n = 58. Scale bar = 100 μm. d Representative confocal images of hippocampal neurons transfected on DIV8 with a plasmid that encoded GFP or Elmo1-GFP and fixed 3 days later. β-Actin-tdTomato was cotransfected to highlight transfected cell morphology. e Number of dendritic ends and f total dendrite length of cells transfected as in d. ns nonsignificant (Mann–Whitney test). Cell images were obtained from three independent culture batches. Number of cells (n): GFP, n = 58; Elmo1-GFP, n = 55. Scale bar = 20 μm. g Representative confocal images of dendrite segments of hippocampal neurons transfected on DIV18 with a plasmid that encoded GFP or Elmo1-GFP and fixed 3 days later. β-Actin-tdTomato was cotransfected to highlight transfected cell morphology. h Average protrusion density, i protrusion width, and j protrusion length per cell of cells transfected as in g. k Cumulative distribution of protrusion length to width ratio of neurons transfected as in g. l, m Contribution of spine and filopodia to the cell protrusion population of transfected cells. ns nonsignificant. **p < 0.01 (Mann–Whitney test). Number of independent cultures N = 2. Number of cells (n): GFP, n = 39; Elmo1-GFP, n = 36. Scale bar = 10 μm

References

    1. Meng X-F, Yu J-T, Song J-H, et al. Role of the mTOR signaling pathway in epilepsy. J Neurol Sci. 2013;332:4–15. doi: 10.1016/j.jns.2013.05.029. - DOI - PubMed
    1. Kotloski RJ, Sutula TP. Environmental enrichment: evidence for an unexpected therapeutic influence. Exp Neurol. 2014;264C:121–126. - PubMed
    1. Olson HE, Poduri A, Pearl PL. Genetic forms of epilepsies and other paroxysmal disorders. Semin Neurol. 2014;34:266–279. doi: 10.1055/s-0034-1386765. - DOI - PMC - PubMed
    1. Aronica E, Gorter JA. Gene expression profile in temporal lobe epilepsy. Neurosci Rev J Bringing Neurobiol Neurol Psychiatry. 2007;13:100–108. - PubMed
    1. Jung K-H, Chu K, Lee S-T, et al. Molecular alterations underlying epileptogenesis after prolonged febrile seizure and modulation by erythropoietin. Epilepsia. 2011;52:541–550. doi: 10.1111/j.1528-1167.2010.02916.x. - DOI - PubMed

MeSH terms

LinkOut - more resources