. 2016 Apr 26;7(17):23919-32.
doi: 10.18632/oncotarget.8081.

Alterations of tumor microenvironment by carbon monoxide impedes lung cancer growth

Affiliations

Alterations of tumor microenvironment by carbon monoxide impedes lung cancer growth

Zsuzsanna Nemeth et al. Oncotarget. .

Abstract

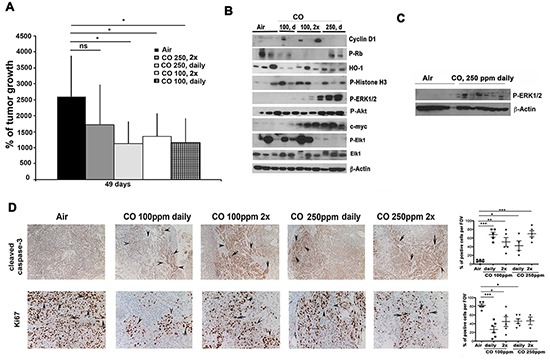
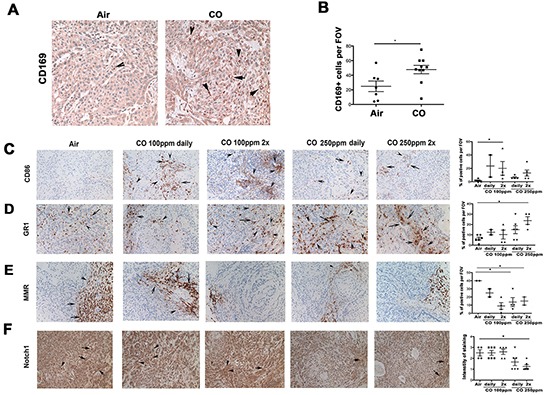
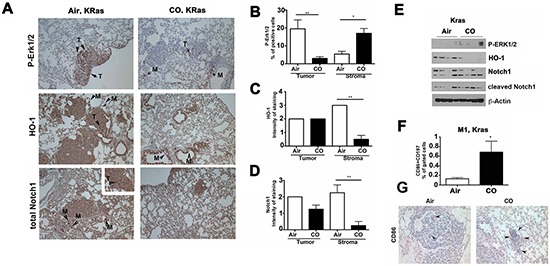
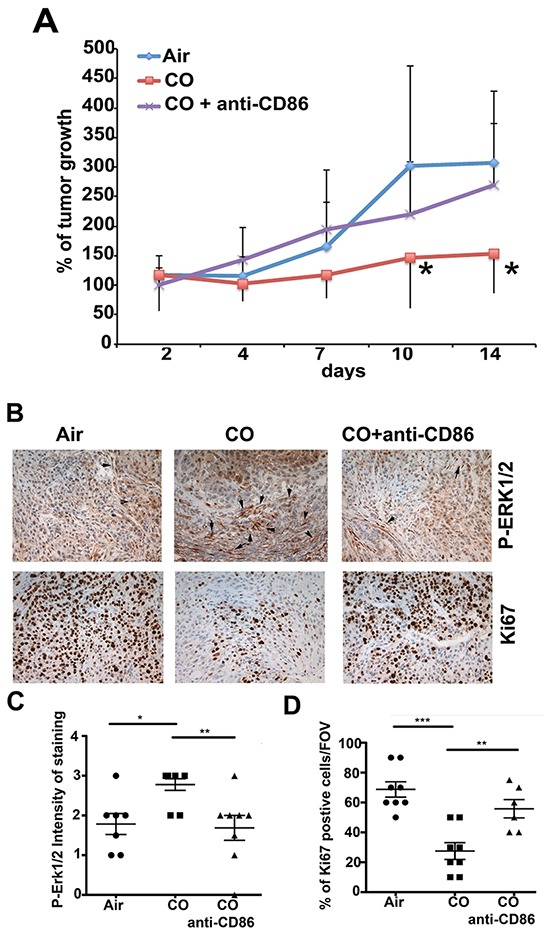
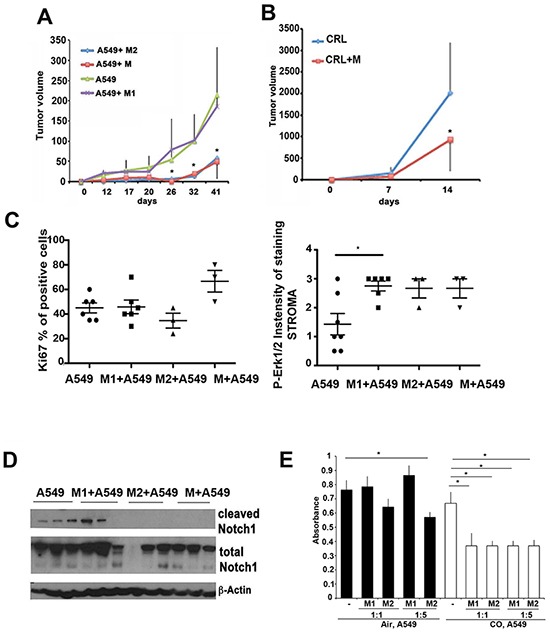
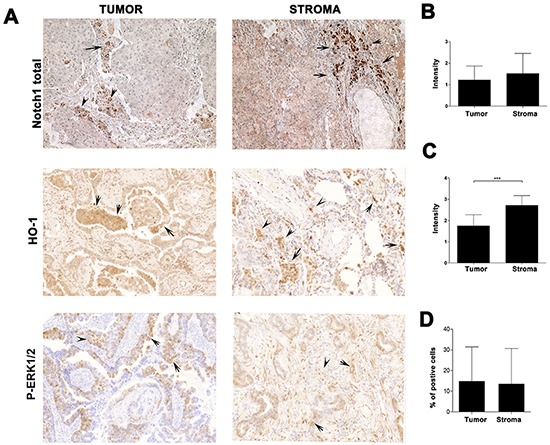
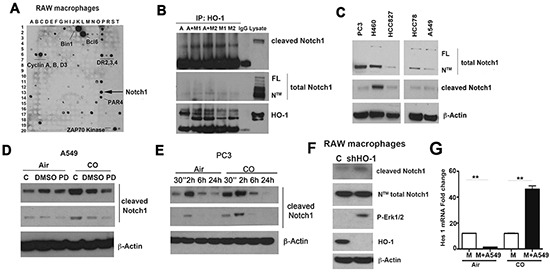
We hypothesized that tumor-associated macrophages (TAMs) are controlled by the diffusible gas carbon monoxide (CO). We demonstrate that induction of apoptosis in lung tumors treated with low doses of CO is associated with increased CD86 expression and activation of mitogen-activated protein kinase (MAPK)/extracellular signal-regulated kinases (Erk) 1/2 pathway in tumor microenvironment. Presence of CD86-positive cells was required for the anti-tumoral effects of CO in established A549 xenografts. We show that the effects of CO on tumor stroma and reprogramming of macrophages towards the anti-tumoral phenotype is mediated by reactive oxygen species (ROS)-dependent activation of MAPK/Erk1/2-c-myc pathway as well as Notch 1-dependent negative feedback on the metabolic enzyme heme oxygenase-1 (HO-1). We find a similar negative correlation between HO-1 and active MAPK-Erk1/2 levels in human lung cancer specimens.In summary, we describe novel non-cell autonomous mechanisms by which the diffusible gas CO dictates changes in the tumor microenvironment through the modulation of macrophages.

Keywords: carbon monoxide; immunotherapy; macrophages; tumor microenvironment.


Conflict of interest statement

Authors declare no competing financial interests in relation to the work described.

Figures

Figure 1
Figure 1. Low doses of CO block growth of lung cancer xenografts
A–B. Tumor volumes of A549 xenografts established in nude mice for 2 weeks and then treated with air, CO (1h, 250 ppm) twice per week (2x), CO (1h, 250 ppm) daily or CO (1h, 100 ppm) twice per week (2x), CO (1h, 100 ppm) daily for 49 days. % of tumor growth at 49 days versus the time zero when CO treatments started are shown. n=4-8 tumors per group. Averages±SD. * p<0.05: CO (different doses) treated versus air at day 49. Analyses of all treatment time points: p<0.05 for CO versus air for all treatments at day 45 and 49. p<0.05 for CO 2x week at 100 ppm at 37 days. B. Protein lysates of xenograft tumor samples from A were analyzed by immunoblotting for expression of cell cycle proteins and activity of signaling pathways. C. Lewis lung carcinoma (CRL) syngeneic model in C57BL/6 mice were established for a week and treated with 250 ppm CO daily for 1h for a week. Immunoblotting of whole lysates of tumors was performed testing expression of P-Erk1/2. n=6 (Air), n=8 (CO) tumors per group (n=3-4 mice per group). D. Immunohistochemistry of A549 xenograft tumors was performed with antibodies for detection of apoptosis (Cleaved caspase-3) and proliferation (Ki67).
Figure 2
Figure 2. CO enhances infiltration of myeloid cells into tumor microenvironment or their skewing towards M1-like macrophages and additionally increases apoptosis in tumor cells
A–F. Immunohistochemistry of A549 xenograft tumors as in Figure 1 (A549 xenografts established in nude mice and treated with 100 ppm or 250 ppm CO (1h) given daily or twice per week (2x)) was performed with antibodies for detection of myeloid cell markers. Quantification of n=2-6 sections is shown. A–B. Immunohistochemical analysis of CD169, phagocytic macrophage marker. C. CD86, mature M1-like macrophage and antigen presenting cell (APC) marker. D. Gr-1, granulocytes marker. E. MMR (CD206), M2-like macrophage marker F. Total Notch 1, for detection of the receptor expression level of activation signaling pathway in M1-like macrophages. *p<0.05, **p<0.01, *** p<0.001 CO treated versus air control. Magnification 200x. Quantification was performed by evaluating % of positive area per field of view. Arrows indicate cells positive for staining.
Figure 3
Figure 3. CO activates Erk1/2 and Notch1 signaling in Kras model of lung cancer
A. Immunohistochemistry with antibodies against P-Erk1/2, HO-1 and total Notch1 in Kras tumors from mice treated with Air or CO (250ppm) for 5 weeks daily after initial establishment of tumors for 13 weeks. B–D. Semiquantitative evaluation of stainings, n=4-5 mice per group. Evaluation of number of cells or % of positive area per field of view at 200x in the stroma or in the lung cancer nodules was performed. E. Western blot analysis of Kras tumors treated as in A. n=4/group. F. Flow cytometry analysis of Kras tumor samples for expression of CD86 and CD197, markers of M1-like phenotype of macrophages. n=3/group. *p<0.05 CO versus Air. G. Immunohistochemistry with antibody against CD86 was performed on tissues of Kras tumors treated as in A. n=3/group. Arrows indicate CD86-positive cells in the tumor area.
Figure 4
Figure 4. Requirement of CD86high cells in tumor niche for CO effects
A. Growth curves of A549 xenografts established in nude mice for 2 weeks and treated with 100 ppm CO (1h) twice per week ±CO ± anti-CD86 neutralizing antibody (100 mg/mouse, i.p.). % of tumor growth as compared to size at initiation of CO treatment as averages±SD. n=6-8 tumors per group. *p<0.05: CO versus Air. B–D. Immunohistochemistry with antibodies against P-Erk1/2 and Ki67 in xenograft tumors treated as in A. Quantification of staining is shown in C (P-Erk1/2) and D (Ki67) from n=4-5 mice per group. Evaluation is presented as intensity of staining (scored on a 1-4 scale with 1-low staining and 4-very strong staining) or % of positive area per field of view under 200x magnification. *p<0.05, **p<0.01, ***p<0.001.
Figure 5
Figure 5. Macrophage polarization influences lung cancer initiation and progression
A–B. Tumors were established from co-injected A549 lung carcinoma (A, xenografts) or CRL Lewis lung carcinoma (B, synegenic tumors) and bone marrow derived macrophages (BMDM) polarized to M1 or M2 phenotype in vitro or non-polarized (M). Growth of tumors was evaluated over the period of 41 days in A549 xenografts and for 2 weeks in CRL xenografts. *p<0.05, A549+wt or M2 macrophages versus A549. C. Quantification of immunohistochemistry with antibodies against Ki67 and P-Erk1/2 was performed on established A549 xenografts as in A. D. Western blot with antibodies against HO-1, P-Erk1/2, cleaved Notch1 and total Notch1 in A549 xenografts as in A. Data are representative for n=3 per group. E. In vitro coculture of A549 cells and M1-like and M2-like BMDM for 24 hours in the ratio 1:2 or 1:5 co-treated with CO (250 ppm) or air. *p<0.05, M2 versus non-treated A549 or CO versus CO+M1/M2. Data are representative for n=3 experiments in duplicates.
Figure 6
Figure 6. Expression of HO-1, Notch1 and P-Erk1/2 in the stroma of lung cancer patients.
Immunohistochemistry analyses of n=30 human patients with dissectible lung carcinoma in the tumor or stroma areas. Total Notch1, HO-1 and P-Erk1/2 stainings are shown in A. and quantification is presented in B–D. Intensity of staining was evaluated on a scale of 0 as being negative to 4 being the strongest positive. ***p<0.01; stroma versus tumor HO-1 expression. Arrows indicate cells positive for specific markers.
Figure 7
Figure 7. Heme degradation pathway crosstalks with Notch1 signaling
A. ELISPOT analysis of HO-1 interacting proteins in RAW macrophages. B. Immunoprecipitation with antibody against HO-1 in A549 alone or in co-culture with M1 or M2 polarized BMDM. Detection of cleaved and total Notch1 (FL –full length protein, N™-cleaved transmembrane/intracellular region) in the immunoprecipitates was performed by western blot. IgG is a negative control; lysate- A549 cell line. C. Expression levels of cleaved and total Notch1 in prostate (PC3) and lung cancer lines (H460, HCC827, HCC78, A549). D. Immunoblotting with antibodies against cleaved Notch1 in lysates of A549 cell lines treated with PD98059 (50 mM) for 1h prior CO (250 ppm) treatment for 24 h. E. PC3 cells were treated with CO (250 ppm) for 30 min-24h and levels of cleaved Notch1 were measured by western blot. F. RAW264.7 macrophages were stably transfected with micro-adapted shRNA against HO-1 (shRNA HO-1) and control vector (C) using retroviral transfer. Stable clones were harvested for western blot analysis. Data are representative for 3 independent measurements. G. Real time PCR with primers against Hes1 was performed using mRNA isolated from A549 cells co-incubated with BMDM (wt) in a ratio 1:5. Co-culture was performed for 24h in the presence of CO (250 ppm) or air (untreated control). **p<0.01 wt versus wt+A549.

References

    1. Mizuguchi S, Stephen J, Bihari R, Markovic N, Suehiro S, Capretta A, Potter RF, Cepinskas G. CORM-3-derived CO modulates polymorphonuclear leukocyte migration across the vascular endothelium by reducing levels of cell surface-bound elastase. American journal of physiology Heart and circulatory physiology. 2009;297:H920–929. - PubMed
    1. Wegiel B, Hedblom A, Li M, Gallo D, Csizmadia E, Harris C, Nemeth Z, Zuckerbraun BS, Soares M, Persson JL, Otterbein LE. Heme oxygenase-1 derived carbon monoxide permits maturation of myeloid cells. Cell Death Dis. 2014;5:e1139. - PMC - PubMed
    1. Wegiel B, Hanto DW, Otterbein LE. The social network of carbon monoxide in medicine. Trends in molecular medicine. 2013;19:3–11. - PMC - PubMed
    1. Elguero B, Gueron G, Giudice J, Toscani MA, De Luca P, Zalazar F, Coluccio-Leskow F, Meiss R, Navone N, De Siervi A, Vazquez E. Unveiling the association of STAT3 and HO-1 in prostate cancer: role beyond heme degradation. Neoplasia. 2012;14:1043–1056. - PMC - PubMed
    1. Nemeth Z, Li M, Csizmadia E, Dome B, Johansson M, Persson JL, Seth P, Otterbein L, Wegiel B. Heme oxygenase-1 in macrophages controls prostate cancer progression. Oncotarget. 2015;6:33675–88. doi: 10.18632/oncotarget.5284. - DOI - PMC - PubMed

MeSH terms