. 2016 Apr 26;7(17):23885-96.
doi: 10.18632/oncotarget.8127.

Inactivation of RASA1 promotes melanoma tumorigenesis via R-Ras activation

Affiliations

Inactivation of RASA1 promotes melanoma tumorigenesis via R-Ras activation

Hyeran Sung et al. Oncotarget. .

Abstract

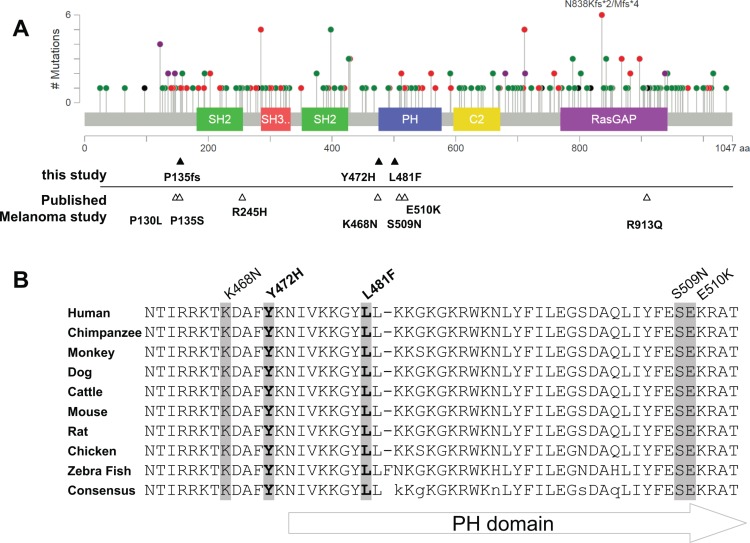
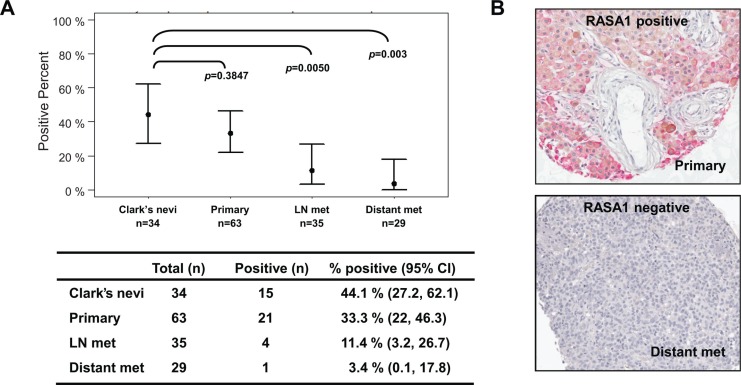
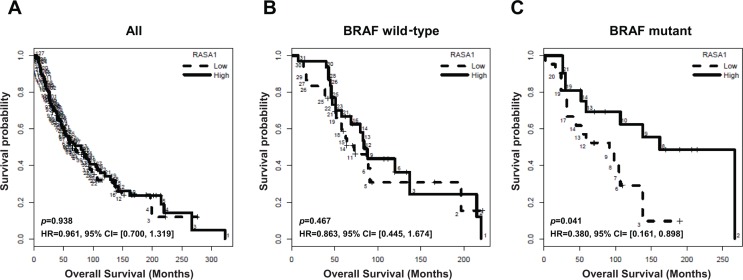
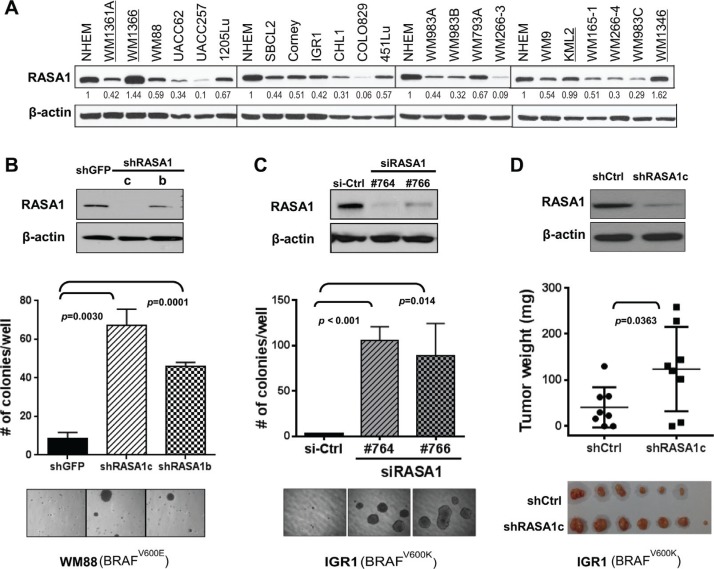
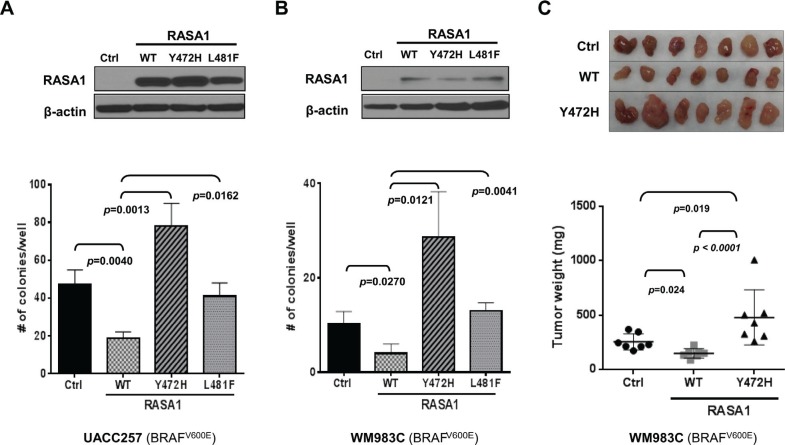
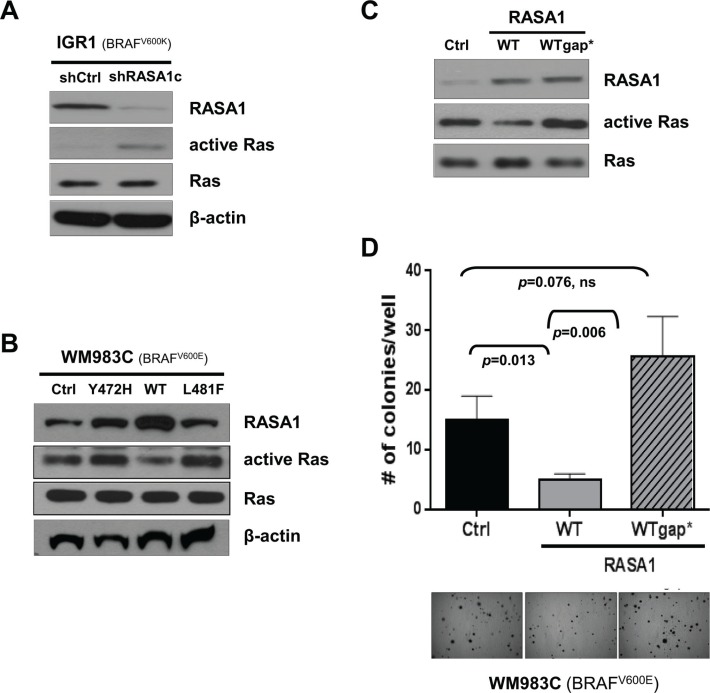
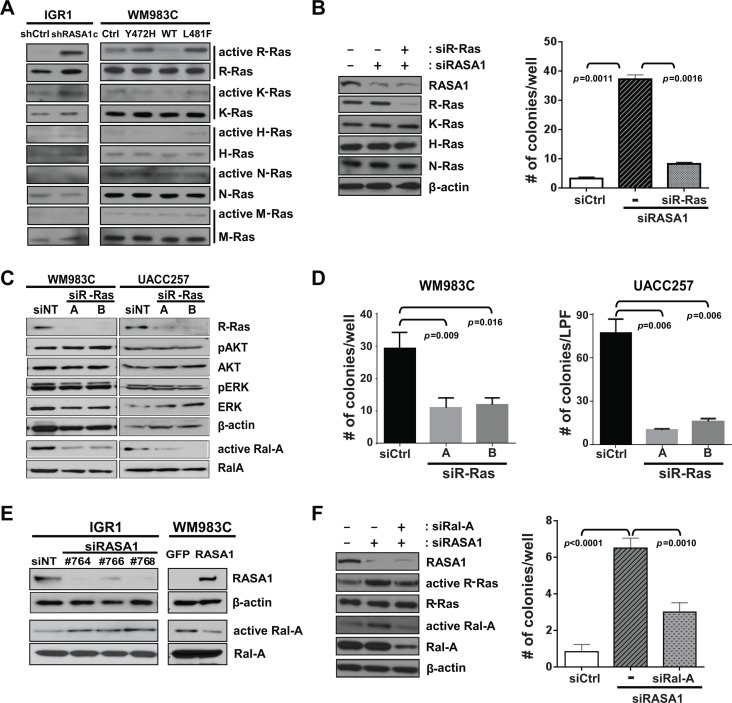
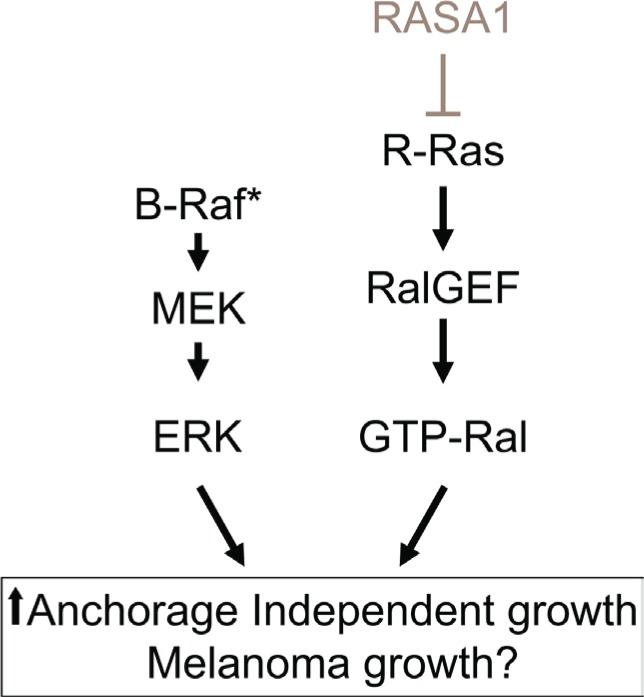
Inactivation of Ras GTPase activating proteins (RasGAPs) can activate Ras, increasing the risk for tumor development. Utilizing a melanoma whole genome sequencing (WGS) data from 13 patients, we identified two novel, clustered somatic missense mutations (Y472H and L481F) in RASA1 (RAS p21 protein activator 1, also called p120RasGAP). We have shown that wild type RASA1, but not identified mutants, suppresses soft agar colony formation and tumor growth of BRAF mutated melanoma cell lines via its RasGAP activity toward R-Ras (related RAS viral (r-ras) oncogene homolog) isoform. Moreover, R-Ras increased and RASA1 suppressed Ral-A activation among Ras downstream effectors. In addition to mutations, loss of RASA1 expression was frequently observed in metastatic melanoma samples on melanoma tissue microarray (TMA) and a low level of RASA1 mRNA expression was associated with decreased overall survival in melanoma patients with BRAF mutations. Thus, these data support that RASA1 is inactivated by mutation or by suppressed expression in melanoma and that RASA1 plays a tumor suppressive role by inhibiting R-Ras, a previously less appreciated member of the Ras small GTPases.

Keywords: R-Ras; RASA1; RasGAP; melanoma; whole genome sequencing.


Conflict of interest statement

The authors disclose no potential conflicts of interest.

Figures

Figure 1
Figure 1. Mutation distribution in RASA1
(A) A schematic of human RASA1 showing the distribution of the mutations identified in all cancer types (adapted from cBioPortal) with conserved protein functional domains: SH2, PH, SH3, C2, and RasGAP domains. Green: missense mutation; Red: nonsense, frame shift, and splice site mutation; Black: in frame deletion; and Purple: combination of Red and Green mutations. Note some recurrent alterations. Mutations identified in melanomas are marked under the graph (filled triangles: this study, empty triangles: published melanoma studies). (B) Alignment of RASA1 sequence around the PH domain among different species. Five out of ten mutations identified in melanomas are localized within this highly conserved region (< 50 amino acids).
Figure 2
Figure 2. RASA1 is down-regulated in metastatic melanomas
RASA1 protein level on a human melanoma tissue microarray (TMA) containing Clark's nevi (n = 34), primary melanomas (n = 63), lymph node metastases (n = 35) and distant metastases (n = 29). In (A) the number of samples with RASA1 expression in each category and confidence interval (CI) with associated p-values comparing to Clark's nevi group (Bonferroni corrected Fisher's exact test) is shown. Representative images of RASA1 positive and negative cores are shown in (B).
Figure 3
Figure 3. Association of RASA1 mRNA level with overall survival of melanoma patients
Kaplan-Meier overall survival curves of melanoma patients in this cohort for all samples (A) (n = 253), BRAF wild type (B) (n = 61), and BRAF mutant samples (C) (n = 42) are shown. Samples are divided into high (above median) and low (below median) RASA1 expression groups, based on the average intensity of the two RASA1 probe sets.
Figure 4
Figure 4. Loss of RASA1 promotes anchorage-independent colony formation
(A) RASA1 expression in human melanoma cell lines in comparison to normal human epithelial melanocytes (NHEM). Protein level was quantitated using image J software and relative RASA1 to β-actin ratio was normalized against that of NHEM. Cell lines with NRAS mutation are underlined. (B and C) (Top) Immunoblotting of RASA1 protein levels in WM88 transduced with shRNA targeting RASA1 (shRASA1c and b) or shGFP (B) and in IGR1 cells transfected with siRNA targeting RASA1 (si#764and #766) or siCtrl (non-targeting siRNA) on day 4 post transfection (C). (Bottom) Number of colonies grown on soft agar on day 21 (B) or on day 15 (C) counted per well. Graph shows data as mean +/− SD. Representative microscopic images are shown. (D) Subcutaneous tumors generated with IGR1 cells with pLKO.1 vector control (shCtrl) or with shRASA1c (bottom) and tumor weights (middle) on day 48 for each group. Data expressed as mean +/− SD.
Figure 5
Figure 5. Expression of RASA1 wild type (WT), but not Y472H and L481F mutants, suppresses anchorage-independent growth in vitro and tumor growth in vivo
Wild type (WT), Y472H, or L481F mutant form of RASA1 was expressed in UACC257 (A) and WM983C (B and C). (A and B) Ectopic expression was confirmed by immunoblotting with anti-RASA1 antibody (top). Graph shows the mean (+/− SD) number of colonies grown on soft agar on day 21 counted per well (Bottom). (C) Subcutaneous tumors generated with WM983C cells (top) and tumor weights (bottom) on day 29 for each group. Statistical analysis was performed using one-way ANOVA with Tukey's multiple comparison adjustment. Data shown graphically as mean +/− SD.
Figure 6
Figure 6. RASA1 functions as a tumor suppressor via its effects on Ras
(A and B) Ras activity in IGR1 cells with or without siRNA-mediated RASA1 knock-down (A) and in WM983C cells with vector control (Ctrl) or with wild type (WT), Y472H, or L481F mutant forms of RASA1 expression (B) was determined by pulling down active GTP-bound Ras and immunoblotting with pan Ras antibody. (C and D) Ras activity of WM983C cells expressing wild type RASA1 (WT) or Q938H mutant RASA1 (WTgap*) with impaired RasGAP activity (C) and number of soft-agar colonies per well on day 21 (mean +/− SD) with representative microscopic images (D).
Figure 7
Figure 7. RASA1 suppresses activation of R-Ras and Ral-A
(A) GTP-bound active-Ras in IGR1 and in WM983C is probed with isoform-specific antibodies against H-, K-, N-, M-, and R-Ras. (B) R-Ras expression is knocked-down with RRAS siRNA in IGR1 cells with RASA1 knock-down (#764 siRNA) (left: western blot). Number of soft-agar colonies per well expressed as mean +/− SD (right panel) on day 17 counted under the microscope are shown. (C) Level of R-Ras, pAKT, AKT, pERK, ERK, Ral-A and β-actin was determined by western blot analysis in WM983C and UACC257 cells with (A or B) or without (siNT) siRNA-mediated R-Ras knock-down. Ral-A activity was measured by pulling down GTP bound active Ral proteins with RalBP1-RBD agarose followed by immunoblotting with α-Ral-A antibody. (D) Number of soft-agar colonies per well for WM983C and per low power field (LPF) for UACC257 on day 21 per well (mean +/− SD). (E) Level of RASA1, β-actin, and Ral-A and active GTP-bound Ral-A was determined by western blot analysis in IGR1 with (#764, 766, or 768) or without (siNT) siRNA-mediated RASA1 knock-down and in WM983C cells transduced with adenovirus encoding RASA1 or GFP. (F) Number of soft-agar colonies visible to the naked eye were counted on day 12 per well (right) shown as mean +/− SD.
Figure 8
Figure 8. Model showing the putative cooperation of BRAF/MEK/ERK and RASA1/R-Ras/Ral-A pathways
RASA1 inactivation by mutation or by reduced expression may cooperates with mutant BRAF by increasing R-Ras/Ral signaling to increase anchorage independent growth in vitro and xenograft tumor growth in vivo.

References

    1. Chin L, Garraway LA, Fisher DE. Malignant melanoma: genetics and therapeutics in the genomic era. Genes Dev. 2006;20:2149–2182. - PubMed
    1. Forbes SA, Bhamra G, Bamford S, Dawson E, Kok C, Clements J, Menzies A, Teague JW, Futreal PA, Stratton MR. The Catalogue of Somatic Mutations in Cancer (COSMIC) Curr Protoc Hum Genet. 2008;11 Chapter 10:Unit 10. - PMC - PubMed
    1. Vigil D, Cherfils J, Rossman KL, Der CJ. Ras superfamily GEFs and GAPs: validated and tractable targets for cancer therapy? Nat Rev Cancer. 2010;10:842–857. - PMC - PubMed
    1. King PD, Lubeck BA, Lapinski PE. Nonredundant Functions for Ras GTPase-Activating Proteins in Tissue Homeostasis. Sci Signal. 2013;6:re1. - PMC - PubMed
    1. Bernards A. GAPs galore! A survey of putative Ras superfamily GTPase activating proteins in man and Drosophila. Biochim Biophys Acta. 2003;1603:47–82. - PubMed

MeSH terms