. 2016 Apr 26;7(17):23837-49.
doi: 10.18632/oncotarget.8070.

PIM1 destabilization activates a p53-dependent response to ribosomal stress in cancer cells

Affiliations

PIM1 destabilization activates a p53-dependent response to ribosomal stress in cancer cells

Vinay Sagar et al. Oncotarget. .

Abstract

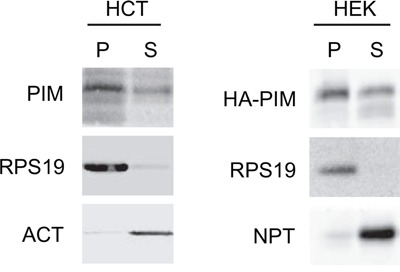
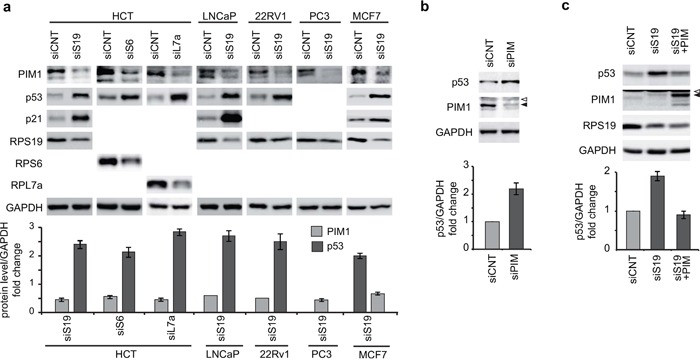
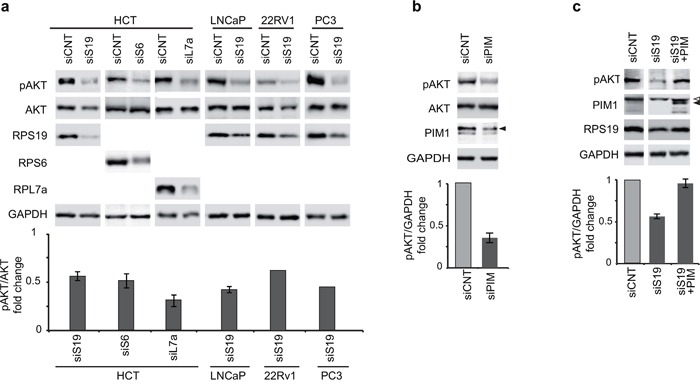
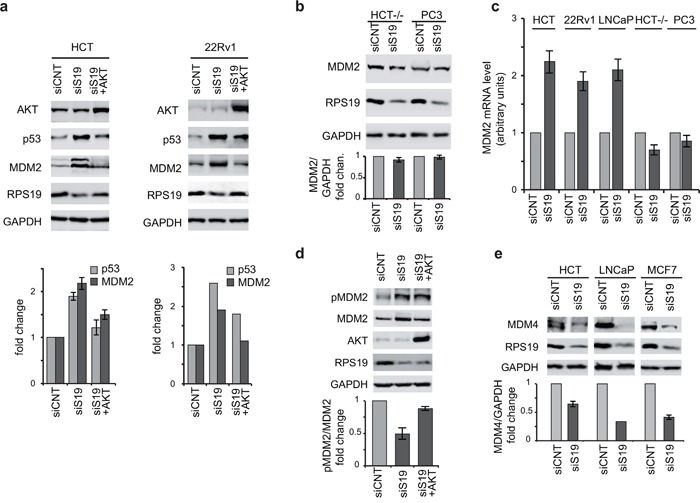
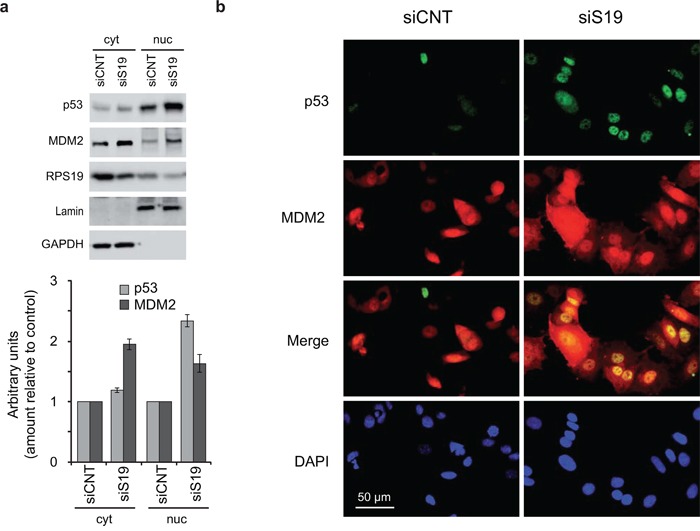
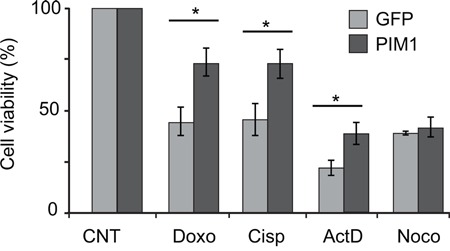
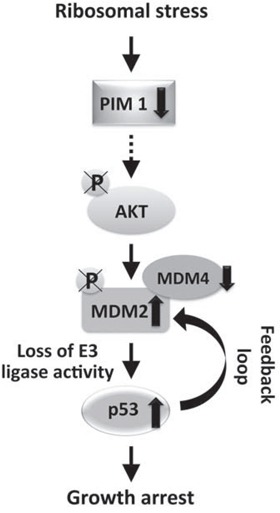
Defects in ribosome biogenesis triggers a stress response (ribosomal stress) that can lead to growth arrest and apoptosis. Signaling pathways activated by ribosomal stress are specifically involved in the pathological mechanism of a group of disorders defined as ribosomopathies. However, more generally, the quality control of ribosome synthesis is part of the regulatory circuits that control cell metabolism. A number of studies identified tumor suppressor p53 as a central player in ribosomal stress. We have previously reported that the kinase PIM1 plays a role as a sensor for ribosome deficiency. In this report we address the relationship between PIM1 and p53 in cancer cell lines after depletion of a ribosomal protein. We identified a novel signaling pathway that includes the kinase AKT and the ubiquitin ligase MDM2. In fact, our results indicate that the lower level of PIM1, induced by ribosomal stress, causes inactivation of AKT, inhibition of MDM2 and a consequent p53 stabilization. Therefore, we propose that activation of p53 in response to ribosomal stress, is dependent on the pathway PIM1-AKT-MDM2. In addition, we report evidence that PIM1 level may be relevant to assess the sensitivity of cancer cells to chemotherapeutic drugs that induce ribosomal stress.

Keywords: AKT; MDM2; PIM1; p53; ribosomal stress.


Conflict of interest statement

The authors declare no competing financial interests.

Figures

Figure 1
Figure 1. PIM1 association with the ribosome
Cytoplasmic extracts from HCT116 and HEK293 transfected with HA-PIM1 were separated by ultra- centrifugation to a pellet (P), containing ribosomes and ribosomal subunits and a supernatant (S), containing free cytoplasmic proteins. The two fractions were analyzed by western blot with primary antibodies against PIM1, RPS19, β-Actin (ACT) and Neomycin phosphotransferase (NPT, encoded by the expression vector). The loading ratio between P and S was 3:1. In the left panel, PIM1 antibody detects endogenous protein whereas in the right panel the transfected HA-PIM1.
Figure 2
Figure 2. Analysis of PIM1 and p53 levels
Total extracts were analyzed by western blot with indicated primary antibodies. Quantification of proteins from at least three independent experiments are reported in lower panels as a column plot of the mean±s.e.m. of the densitometry values normalized by GAPDH. a. Extracts from HCT116, LNCaP, 22Rv1, PC3 and MCF7 cells transfected with indicated siRNA (PIM1 analysis in LNCaP and 22Rv1 is the mean of two experiments). b. Extracts from HCT116 cells transfected with control (siCNT) or with PIM1-specific siRNA (siPIM). c. Extracts from HCT116 cells transfected first with RPS19 specific siRNA (siS19) and then transduced with PIM1-expressing lentivirus. Open triangles indicate non-specific bands; filled triangles indicate PIM1 bands.
Figure 3
Figure 3. Phosphorylation of AKT at Ser473
Total extracts were analyzed by western blot with indicated primary antibodies. Quantification of the signal was carried out as in Figure 2. a. Extracts from HCT116, LNCaP, 22Rv1 and PC3 cells transfected with indicated siRNA (analysis in 22Rv1 and PC3 cells is the mean of two experiments). b. Extracts from HCT116 cells transfected with control (siCNT) or with PIM1-specific siRNA (siPIM). c. Extracts from HCT116 cells transfected first with control (siCNT) or RPS19 specific siRNA (siS19) and then transduced with PIM1-expressing lentivirus. <, non-specific band. The gap between the lanes indicates that part of the gel (containing additional controls) has been eliminated. Open triangles indicate non-specific bands; filled triangles indicate PIM1 bands.
Figure 4
Figure 4. AKT regulate p53 and MDM2
Total protein extracts were analyzed by western blot with indicated primary antibodies. Quantification of the signal was carried out as in Figure 2. a. Extracts from HCT116 and 22Rv1 cells transfected with control siRNA (siCNT), with RPS19-specific siRNA (siS19), or with RPS19-specific siRNA plus AKT expressing plasmid (siS19+AKT). Quantification in 22Rv1 cells is from two independent experiment. b. Extracts from HCT−/− and PC3 cells transfected with control siRNA (siCNT) or with RPS19-specific siRNA (siS19). c. Total RNA was extracted from HCT116, 22Rv1, LNCaP, HCT−/− and PC3 cells transfected with control siRNA (siCNT) or with RPS19-specific siRNA (siS19) and analyzed by qRT-PCR with primers specific for MDM2 and GAPDH. The results of triplicate RT–qPCR from three independent RNA preparations are reported as a column plot of the mean±s.e.m. of MDM2 mRNA normalized by GAPDH mRNA. d. Extracts from HCT116 cells transfected with control siRNA (siCNT), with RPS19-specific siRNA (siS19) or with RPS19-specific siRNA plus AKT expressing plasmid (siS19+AKT). e. Extracts from HCT116, LNCaP and MCF7 cells transfected with control siRNA (siCNT) or with RPS19-specific siRNA (siS19).
Figure 5
Figure 5. Localization of p53 and MDM2
a. Cytoplasmic (cyt) and nuclear (nuc) extracts from HCT116 cells transfected with control (siCNT) or with RPS19-specific siRNA (siS19) were analyzed by western blot with primary antibodies for p53, MDM2, RPS19, Lamin and GAPDH. Quantification from three independent experiments is reported in lower panel as column plot of the mean±s.e.m of the values normalized by control. b. MCF7 cells, transfected with control (siCNT) or with RPS19-specific siRNA (siS19), were fixed and stained with antibodies for p53 and MDM2 and then incubated with FITC–conjugated anti-Rabbit IgG and TRITC-conjugated anti-Moiuse IgG,. The localization of p53 and MDM2 was visualized by fluorescence microscopy.
Figure 6
Figure 6. PIM1 overexpression causes reduced sensitivity to chemoterapeutic drugs
HCT116 cells transduced with PIM1-expressing lentivirus, were treated with Doxorubicin, Cisplatin, Actinomycin D or Nocodazole. After 48 h treatment, cell viability was assessed by MTT assays. Quantification of cell viability from three independent experiments is reported as a column plot of the mean ±s.e.m. of the values normalized by control. *, P<0.05.
Figure 7
Figure 7. Schematic of the signaling pathway activated by ribosomal stress
Ribosomal stress, due to RP depletion, induces a decrease of PIM1 level that inhibits phosphorylation of AKT on Ser473; the consequent AKT inactivation causes a dephosphorylation of MDM2, inhibiting its nuclear import and ubiquitin ligase activity. This generates a stabilization of p53 that, through the feedback loop, induces an increase of total MDM2 level. The high level of MDM2 causes degradation of MDM4 which produces a further stabilization of p53. The final outcome of this signaling pathway is a p53-dependent cell growth inhibition.

References

    1. Fatica A, Tollervey D. Making ribosomes. Curr Opin Cell Biol. 2002;14:313–318. - PubMed
    1. Danilova N, Gazda HT. Ribosomopathies: how a common root can cause a tree of pathologies. Disease models & mechanisms. 2015;8:1013–1026. - PMC - PubMed
    1. Dianzani I, Loreni F. Diamond-Blackfan anemia: a ribosomal puzzle. Haematologica. 2008;93:1601–1604. - PubMed
    1. Narla A, Ebert BL. Ribosomopathies: human disorders of ribosome dysfunction. Blood. 2010;115:3196–3205. - PMC - PubMed
    1. Loreni F, Mancino M, Biffo S. Translation factors and ribosomal proteins control tumor onset and progression: how? Oncogene. 2014;33:2145–2156. - PubMed

MeSH terms