. 2017 Feb;37(2):694-705.
doi: 10.1177/0271678X16639060. Epub 2016 Jul 21.

Cerebral haemodynamics during experimental intracranial hypertension

Affiliations

Cerebral haemodynamics during experimental intracranial hypertension

Joseph Donnelly et al. J Cereb Blood Flow Metab. 2017 Feb.

Abstract

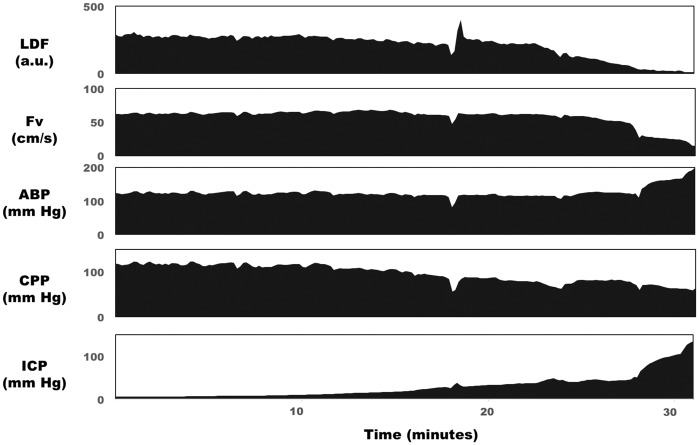
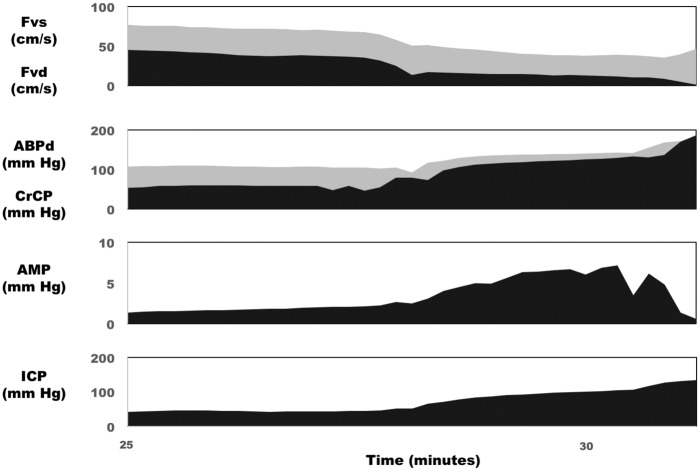
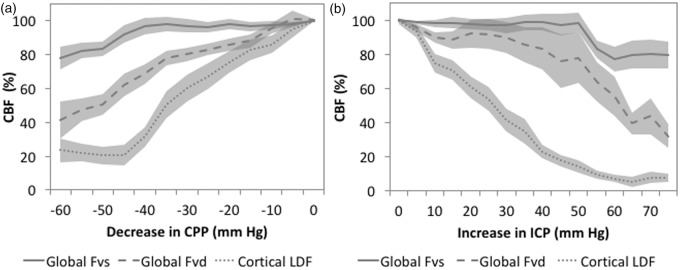
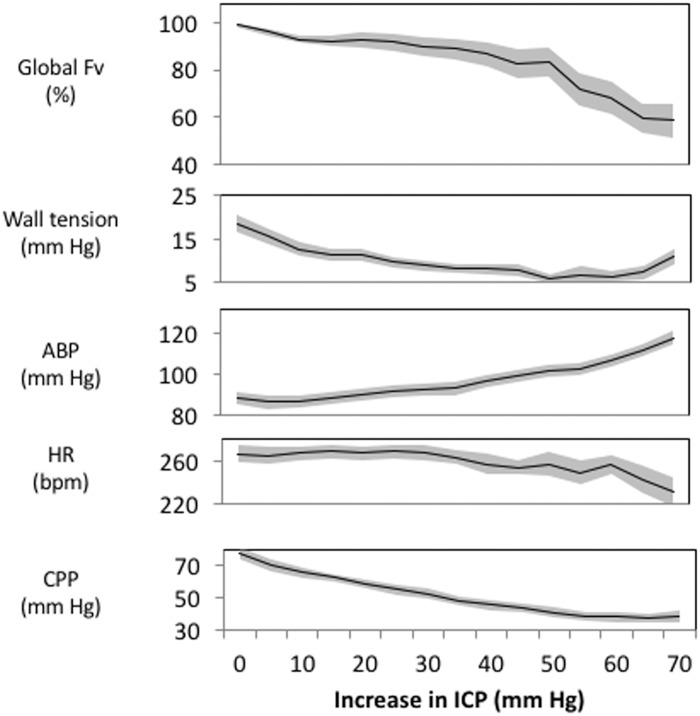
Intracranial hypertension is a common final pathway in many acute neurological conditions. However, the cerebral haemodynamic response to acute intracranial hypertension is poorly understood. We assessed cerebral haemodynamics (arterial blood pressure, intracranial pressure, laser Doppler flowmetry, basilar artery Doppler flow velocity, and vascular wall tension) in 27 basilar artery-dependent rabbits during experimental (artificial CSF infusion) intracranial hypertension. From baseline (∼9 mmHg; SE 1.5) to moderate intracranial pressure (∼41 mmHg; SE 2.2), mean flow velocity remained unchanged (47 to 45 cm/s; p = 0.38), arterial blood pressure increased (88.8 to 94.2 mmHg; p < 0.01), whereas laser Doppler flowmetry and wall tension decreased (laser Doppler flowmetry 100 to 39.1% p < 0.001; wall tension 19.3 to 9.8 mmHg, p < 0.001). From moderate to high intracranial pressure (∼75 mmHg; SE 3.7), both mean flow velocity and laser Doppler flowmetry decreased (45 to 31.3 cm/s p < 0.001, laser Doppler flowmetry 39.1 to 13.3%, p < 0.001), arterial blood pressure increased still further (94.2 to 114.5 mmHg; p < 0.001), while wall tension was unchanged (9.7 to 9.6 mmHg; p = 0.35).This animal model of acute intracranial hypertension demonstrated two intracranial pressure-dependent cerebroprotective mechanisms: with moderate increases in intracranial pressure, wall tension decreased, and arterial blood pressure increased, while with severe increases in intracranial pressure, an arterial blood pressure increase predominated. Clinical monitoring of such phenomena could help individualise the management of neurocritical patients.

Keywords: Intracranial hypertension; cerebral blood flow; cerebral haemodynamics; intracranial pressure; pressure reactivity; vascular function.


Figures

Figure 1.
Figure 1.
Measured haemodynamic response to lumbar CSF infusion in the rabbit. ICP was increased over the period of 30 min from baseline levels (10 mm Hg) to high levels (>100 mm Hg). Cortical LDF (top panel) decreased with this increasing ICP, whereas Fv in the basilar artery remained stable until ICP was above 50 mm Hg. Mean arterial blood pressure increased when ICP increased above 30 mm Hg as part of the Cushing reflex. LDF: laser Doppler flowmetry; Fv: flow velocity in the basilar artery; ABP: arterial blood pressure; CPP: cerebral perfusion pressure; ICP: intracranial pressure.
Figure 2.
Figure 2.
Derived haemodynamic parameters in response to lumbar CSF infusion in the rabbit. In the same rabbit as Figure 1, progressive increases in ICP caused an increase in CrCP, and ABP diastolic, as well as a corresponding decrease in the difference between them – the diastolic closing margin (second panel). At very high ICP, CrCP approached ABPd, which was associated with a drop of diastolic flow velocity to zero (top panel). AMP of ICP increased along with mean ICP until very high ICP, at which point AMP began to decrease (third panel). CrCP: critical closing pressure; ABPd: diastolic arterial blood pressure; Fvs: systolic flow velocity in the basilar artery; Fvd: diastolic flow velocity in the basilar artery; AMP: pulse amplitude of ICP; ICP: intracranial pressure.
Figure 3.
Figure 3.
Upper breakpoint of intracranial mean pressure–amplitude relationship (n=27; mean ± SE). In 11 rabbits, an upper breakpoint of the intracranial mean pressure–amplitude relationship was observed whereby further increases in mean ICP resulted in decreases in the pulse amplitude of ICP. This upper breakpoint was associated with low diastolic closing margins (9.5 mm Hg) and diastolic flow velocities (12.6 cm/s – 30.5% of baseline). ICP: intracranial pressure; AMP: pulse amplitude of intracranial pressure.
Figure 4.
Figure 4.
Cerebral blood flow during lumbar artificial CSF infusion in rabbits (n=27 mean ± SE). (a) Global (as assessed by basilar artery Fv) and cortical (as assessed by LDF) CBF are normalised to baseline CBF and then expressed relative to changes in ICP produced by the lumbar CSF infusion. LDF appears most sensitive to increases in ICP, followed by diastolic flow velocity and then systolic flow velocity. When CBF is plotted against changes in CPP. (b) Again, cortical LDF appears most sensitive to decreases in CPP, followed by diastolic flow velocity and then systolic flow velocity. CBF: cerebral blood flow; Fv: flow velocity; Fvs: systolic flow velocity in the basilar artery; Fvd: diastolic flow velocity in basilar artery; LDF: laser Doppler flowmetry
Figure 5.
Figure 5.
Cerebral haemodynamic response to increasing ICP (n=27 mean ± SE). In this study, group averaged global Fv was well maintained until an ICP 55 mm Hg above baseline (top panel). This maintained Fv was achieved by both a decrease in wall tension and an increase in ABP (panels 2 and 3). HR did not show major changes until relatively large increases in ICP (60–75 mm Hg above baseline; panel 4). As a consequence of the vasopressor response, CPP was relatively buffered especially during relatively large increases in ICP. From baseline ICP to ICP increases of 15–20 mm Hg, CPP decreased from a mean of 78 to 58 mm Hg, whereas from ICP increases of 25 to 30 mm Hg to ICP increases of 35–40 mm Hg CPP only decreased from 54 to 45 mm Hg.

References

    1. Bhatia A, Gupta AK. Neuromonitoring in the intensive care unit. I. Intracranial pressure and cerebral blood flow monitoring. Intensive Care Med 2007; 33: 1263–1271. - PubMed
    1. Beiner JM, Olgivy CS, DuBois AB. Cerebral blood flow changes in response to elevated intracranial pressure in rabbits and bluefish: a comparative study. Comp Biochem Physiol A Physiol 1997; 116: 245–252. - PubMed
    1. Numoto M, Donaghy RM. Effects of local pressure on cortical electrical activity and cortical vessels in the dog. J Neurosurg 1970; 33: 381–387. - PubMed
    1. Zwetnow NN. The influence of an increased intracranial pressure on the lactate, pyruvate, bicarbonate, phosphocreatine, ATP, ADP and AMP concentrations of the cerebral cortex of dogs. Acta Physiol Scand 1970; 79: 158–166. - PubMed
    1. Timofeev I, Czosnyka M, Carpenter KLH, et al. Interaction between brain chemistry and physiology after traumatic brain injury: impact of autoregulation and microdialysis catheter location. J Neurotrauma 2011; 28: 849–860. - PMC - PubMed

LinkOut - more resources